How to create Cloud RGB images
The 'recipe' of the Cloud RGB type is summarized in Table 1. It shows which channels are visualized in which color. The measured values should be calibrated to brightness temperature or reflectivity. (The reflectivity values should be normalized by the cosine of the solar zenith angle.) The images are then enhanced - linearly stretched - within the ranges shown in the table.
| AVHRR Cloud RGB | ||||
|---|---|---|---|---|
| Color | Channel | Range | ||
| Red | VIS0.63 | 0 | 100 | % |
| Green | NIR0.87 | 0 | 100 | % |
| Blue | IR10.8 inverted | 323 | 203 | K |
Table 1: Recipe of the AVHRR Cloud RGB scheme
The following examples show how the Cloud RGB is combined from the VIS0.63, NIR0.87 and IR10.8 images. They show both the resulting RGB image and its components, which are enhanced according to Table 1. IR10.8 images are bright for low and dark for high brightness temperatures.
Figs. 2a, 2b and 2c show a non-convective situation. Mid- and low-level clouds are yellow. Thick high-level clouds appear white. Thin high-level clouds appear bluish. The snow-covered Alps appear yellow with some red tones. The images are from April and the snows are melting, which gives them a lower reflectivity in the NIR0.87 channel than in VIS0.63 (see the curve 'wet snow' in Fig. 2 of chapter 'AVHRR Natural Colour RGB').
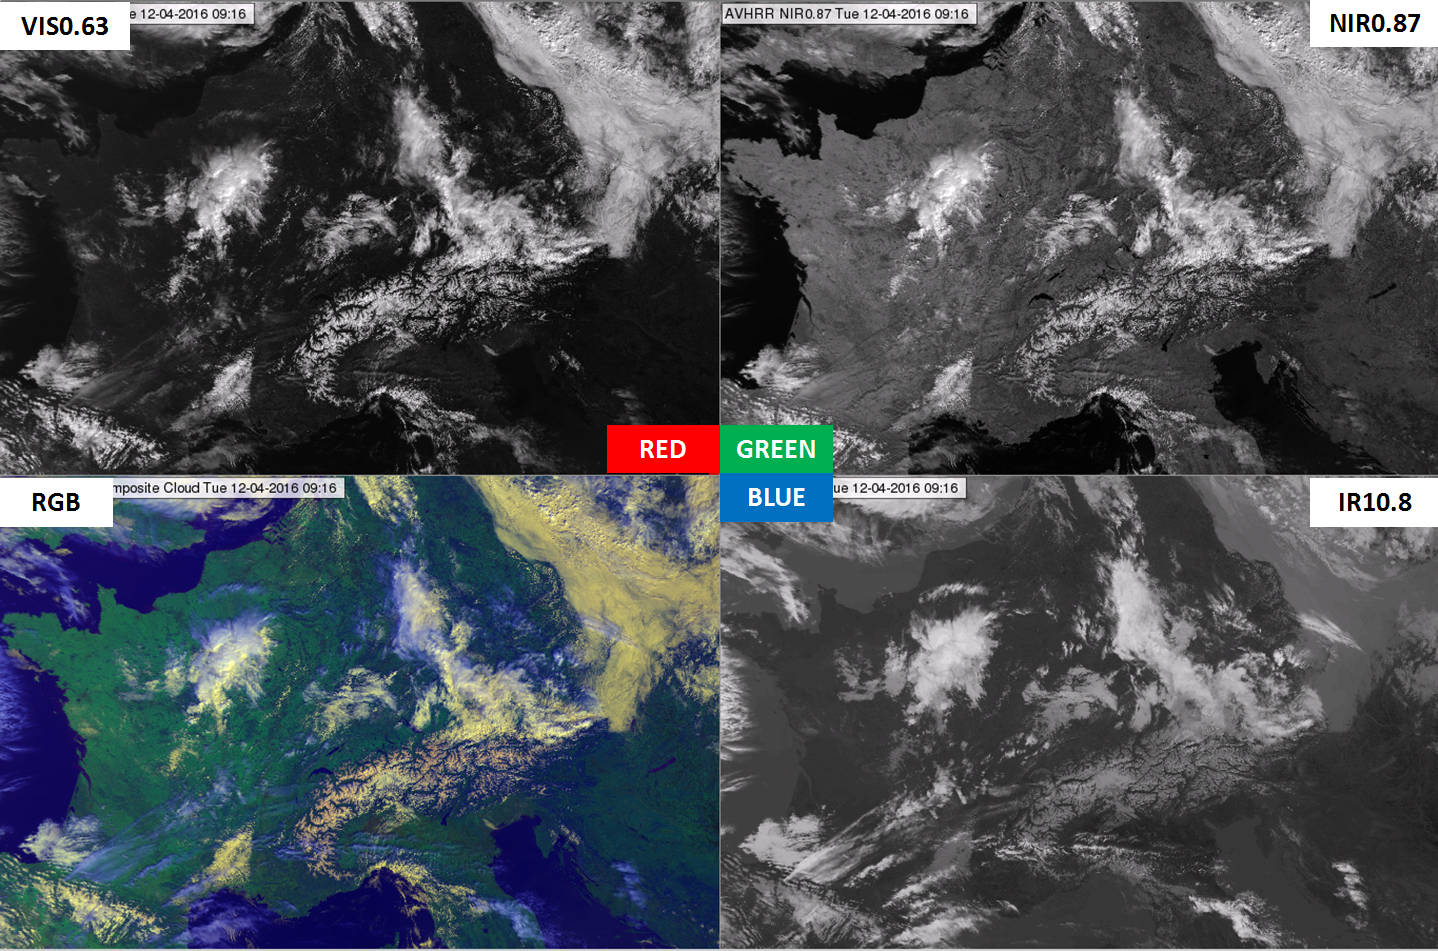
Figure 2a: METOP-A AVHRR VIS0.63 (upper left), NIR0.87 (upper right), Cloud RGB (bottom left) and IR10.8 (bottom right) images on 12 April 2016 at 09:16 UTC
Fig. 2a shows the color components of a Cloud RGB image - the channels which are in the recipe with the corresponding enhancement. The lower left panel shows the Cloud RGB.
Fig. 2b is the same as Fig. 2a except that the three components are visualized in scales of black to red, black to green and black to blue. This is how the three components are used together in the RGB.
Fig. 2c shows the four panels of Fig. 2a on top of each other. Hover your mouse over the image to use the slider.
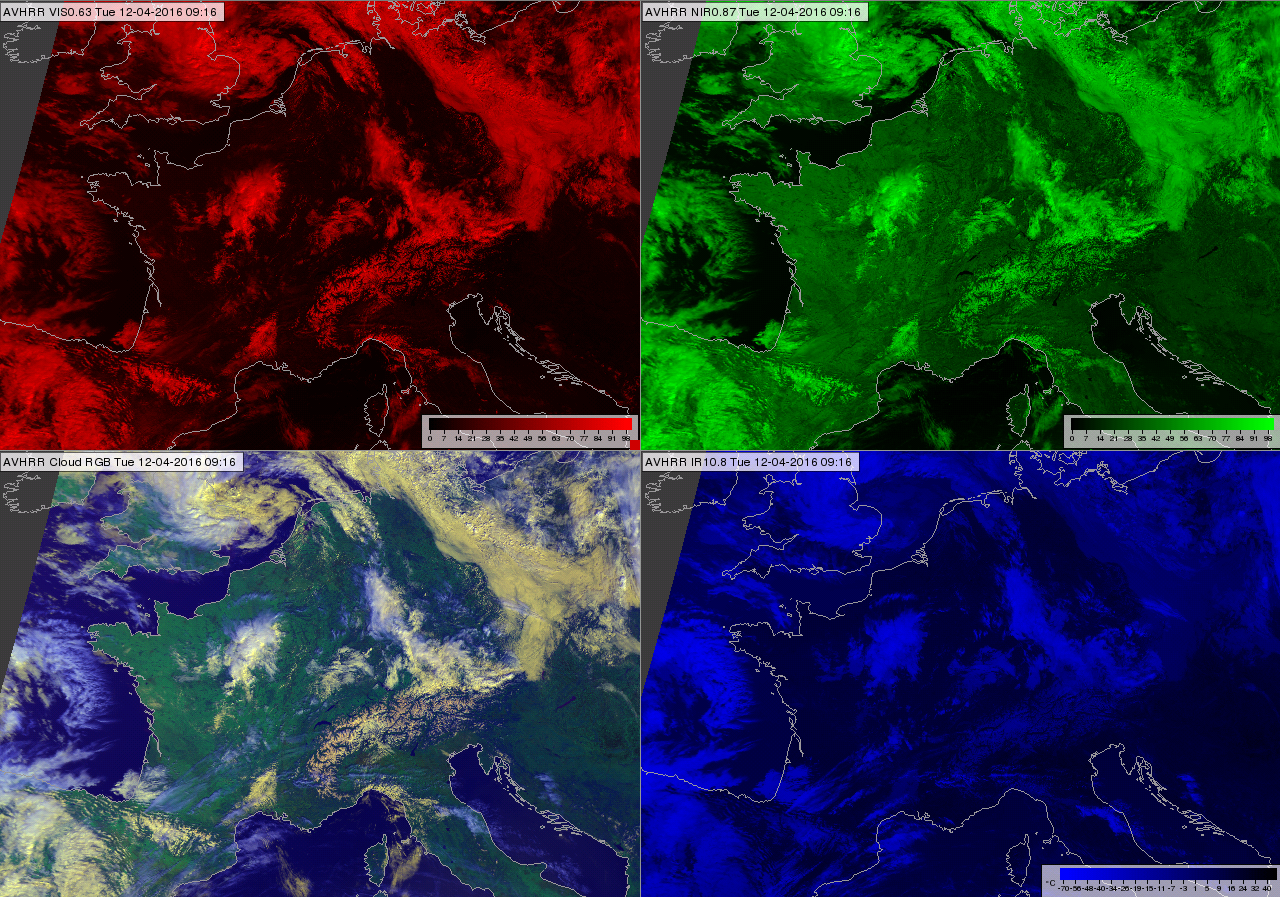
Figure 2b: METOP-A AVHRR VIS0.63 (upper left), NIR0.87 (upper right), Cloud RGB (bottom left) and IR10.8 (bottom right) images on 12 April 2016 at 09:16 UTC
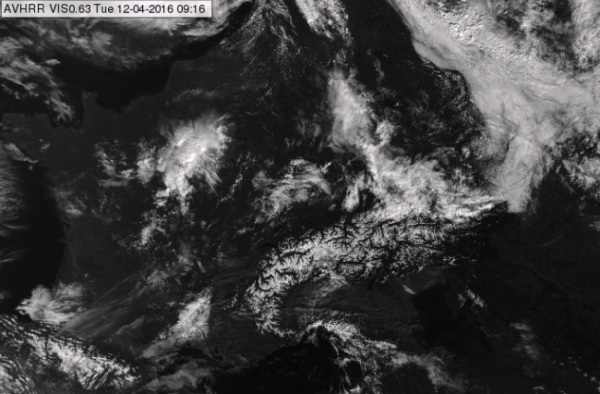
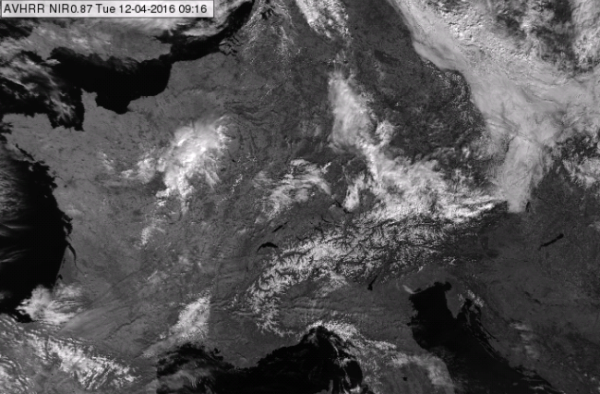
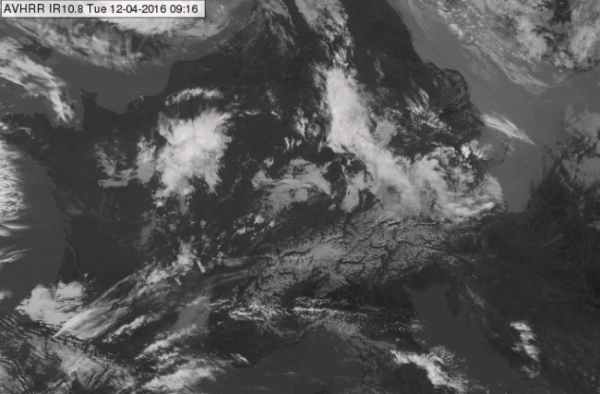
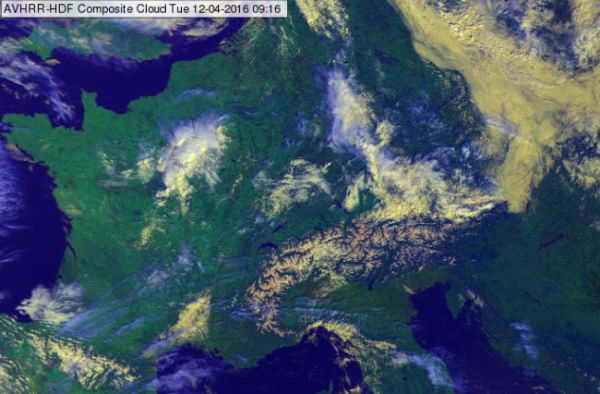
Figure 2c: 4-Panel display, please use your mouse to compare the four images. METOP-A AVHRR VIS0.63, NIR0.87, Cloud RGB and IR10.8 images on 12 April 2016 at 09:16 UTC
Fig. 3 shows convective clouds. The cores of the mature storms are white in the Cloud RGB as they are cold and their reflectivity values are high. The semi-transparent anvils are bluish - their reflectivity is lower, their brightness temperature is warmer, while the blue component is still dominant. (Semi-transparent cirrus clouds show better in thermal infrared than the shortwave spectral region.) The overshooting tops are visible because of their shadows. Some lower level clouds are also seen in the southern part of the image. Their high reflectivity and medium brightness temperature gives them a yellow color.
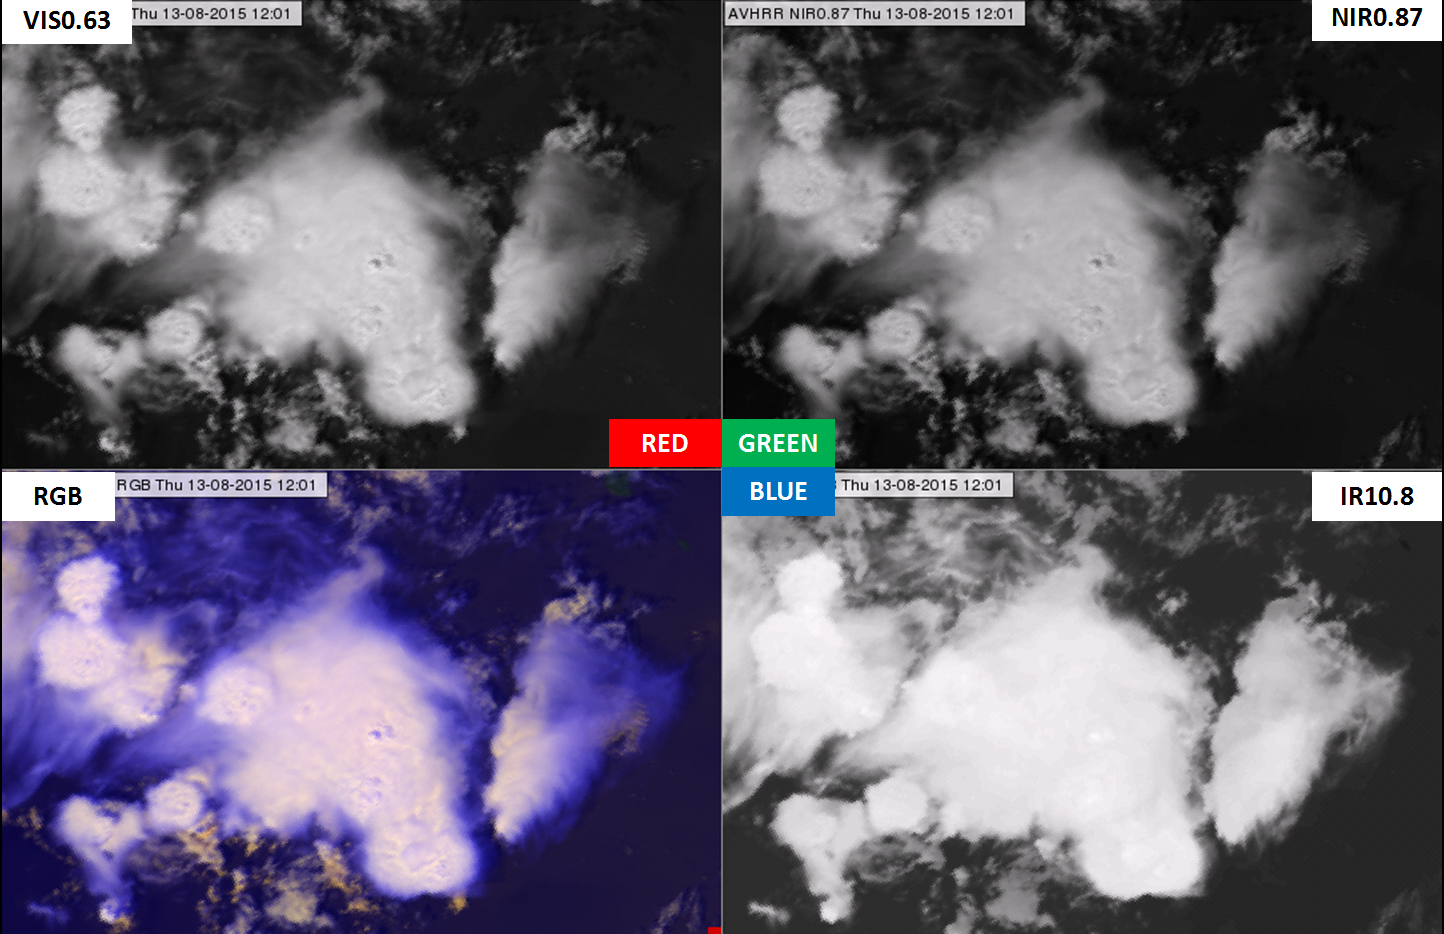
Figure 3: AVHRR VIS0.63 (upper left), NIR0.87 (upper right), Cloud RGB (bottom left) and IR10.8 (bottom right) images on 13 August 2015 at 12:01 UTC