Fire Weather Index
The combination of factors into some understandable indexes that output a single fire risk when combined is a pretty reasonable solution. One of the most well-known indexes is the Canadian Fire Weather Index - FWI. In fact, outputting a single value for risk is what matters the most. If the risk of fire is high, it is not that relevant for firefighters (for practical purposes) which contributes more to therisk, the weather or the fuel.
FWI is made of surface observations at noon and represents fire danger at mid-afternoon. You will see that FWI is composed of individual indexes that give information on specific details. Let's see the meaning of each sub-index:
FFMC - This index classifies the moisture content of litter and other cured fine fuels, like needles or twigs less than 1 cm in diameter. FFMC is representative of the top litter layer 1-2 cm deep and has a short-term memory, only reflecting weather conditions that have occurred over the past three days (Figure 3.14).
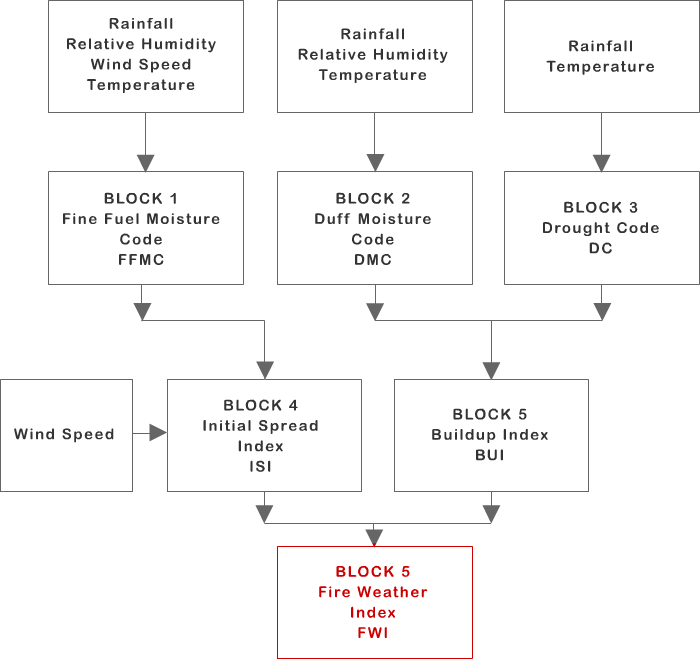
DMC - This index indicates the moisture content of loosely-compacted organic layers with a depth of 5-10 cm. DMC fuels have a slower drying rate than FFMC fuels and DMC may be used in predicting the probability of fire ignition by lightning.
DC - This third moisture index reflects the moisture content of compact organic layers, 10-20 cm deep. DC is indicative of long-term moisture conditions and deep burning fires, being related to mop-up and patrol difficulties.
ISI - This index combines FFMC and wind speed, being a good indicator for fire spread. Moreover, if the topography is known, the slope effect on fire spread may be converted into a wind speed equivalent and added to the real wind speed.
BUI - This index is a weighted combination of the DMC and DC indexes and represents the total fuel available for the spreading of fire.
As a conclusion you can say that FWI gives a single value for potential frontal fire intensity, combining the rate of fire spread with the amount of fuel being consumed.
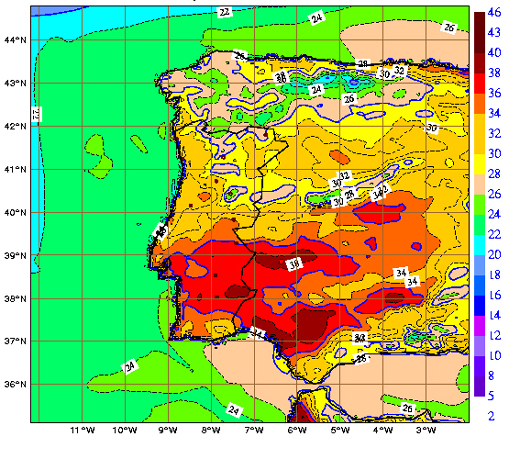
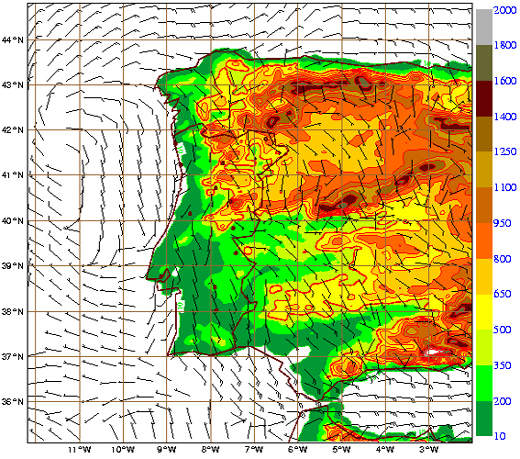
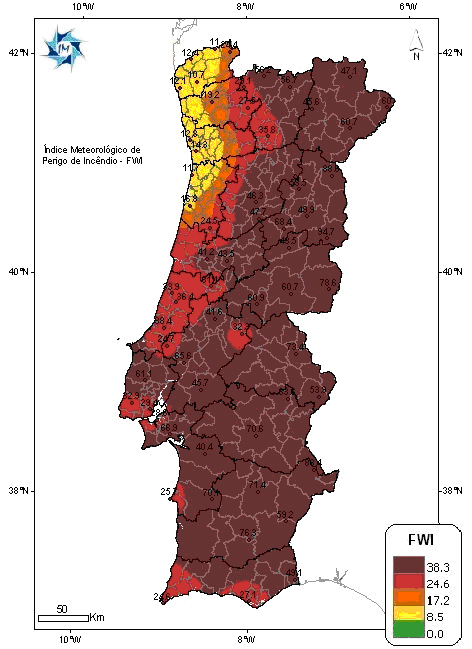
As an example, you can check the difference in patterns between the forecast fields of a limited area model (Figure 3.15 and 3.16) and the FWI index computed on the verification date (Figure 3.17). The forecast is for 12 UTC on 3 August 2003, which was the day following the aforementioned 2003 event. Thus we conclude that the pattern for forest fires due to weather parameters (FWI) differs from the single patterns for 2m temperature or 10m wind.
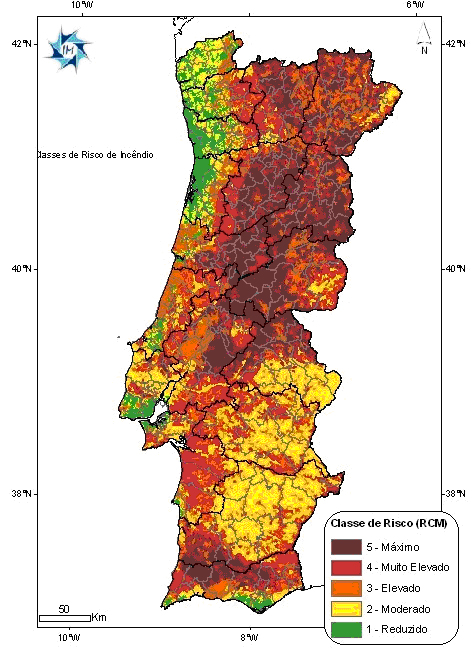
Furthermore, Figure 3.18 represents classes of fire risk that result from the combination of FWI with a structural map that remains constant throughout the year (and accounts for available fuel!).
If we look at the image from MODIS with the identified hot spots for this day (Fig. 3.19) we can conclude that it is quite consistent with figure 3.18; the locations where fires were identified match the regions with the highest risk for fire.

Maps of fire risk derived from satellite data are currently being produced in the LSA SAF project (the RFM product). This is a daily product that takes as input a satellite-derived LandCover map and Numerical Weather Prediction forecast data from the ECMWF (European Centre for Medium-Range Weather Forecasts) model. The main objective of the RFM algorithm is to compute daily values for the set of components in the Canadian Forest Fire Weather Index System (CFFWIS) for Mediterranean Europe, as well as levels of fire danger associated with the probabilitiesof fire occurrences exceeding specified magnitudes. The motivation for this is to provide the user community with information on meteorological risk that will allow for adopting the adequate measures to mitigate fire damage.
But you should be aware that, apart from FWI, there are other indexes being used throughout the world to identify fire risk.
FWI is an already complex index, but it can be used in even broader systems for national fire management. In Canada, for example, the system has been called the Canadian Forest Fire Danger Rating System (CFFDRS) and, besides the FWI index (which is the first major subsystem), it comprises a Forest Fire Behaviour Prediction System (FBP). This second major subsystem includes an extensive list of fuel types (Table 3.1), estimates for fuel consumption and fire intensity, and also provides comprehensive models for fire growth and crown fires - you will learn more about crown fires later on in this module.
Of course, there are also other complex systems currently in use around the globe using FWI or other indexes. You can see a short list of these systems below:
- The US National Fire Danger Rating System (NFDRS) with 4 main indexes: energy release component, spread component, burning index and ignition component. More information found at the main website Rocky Mountain Center Fire Weather and at Wildland Fire Assessment System (WFAS).
- The Australian Bureau of Meteorology system, with a Forest Fire Danger Index (FFDI) based on temperature, relative humidity, wind speed and a drought factor. The drought factor is state dependent: the Keech-Byram Draught Index (KBDI) is used in Queensland, Victoria and New South Wales; the Mount Soil Dryness Index (Mount SDI) is used in South Australia and Tasmania
- The European Forest Fire Information System (EFFIS).
- The Portuguese Meteorological Service System, with the computation of a Combined Index for Forest Fire Risk (ICRIF, Portuguese acronym). ICRIF combines FWI, a structural index and a vegetation index. The structural index is obtained from a land cover database (CORINE 2000), associating a specific risk weight to each of the 44 classes of land cover. The vegetation index is the NDVI, which you already had the opportunity to analyze before in this module. (www.meteo.pt, Bugalho and Pessanha, 2007).
The Canadian forestry serivces have been studying forest fire behavior comprehensively for decades, and if, after concluding this module, you still want to learn more on fire risk and fire behaviour you are strongly advised to take a closer look at these two documents in the references: Van Wagner (1987) and Foresty Canada (1992).