In this chapter we will discuss the common weather patterns that favor forest fires. You will learn how to combine the locations of depressions and high pressure ridges with upper level features and temperature distributions.
Typical synoptic pattern in NWP data
We will start with the famous and deadly heat wave that hit Western Europe in the summer of 2003. Portugal was plagued by a huge amount of uncontrolled forest fires (more than 1500 in August alone), leading to a total burnt area of around 424.000 hectares in the whole year. This corresponds to about 4.5% of the country's land area.
|
|
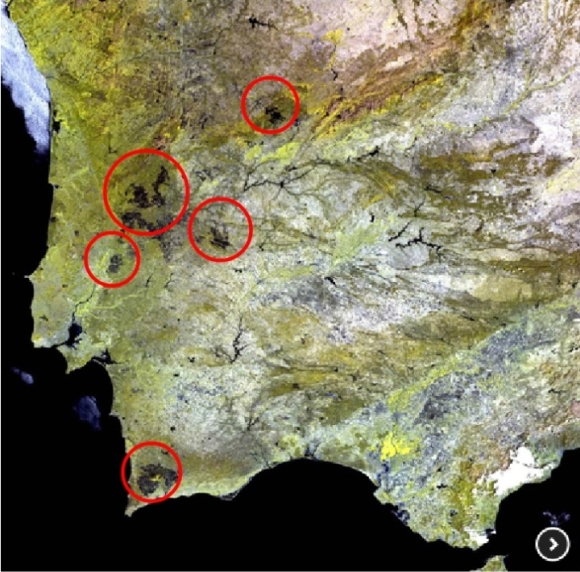
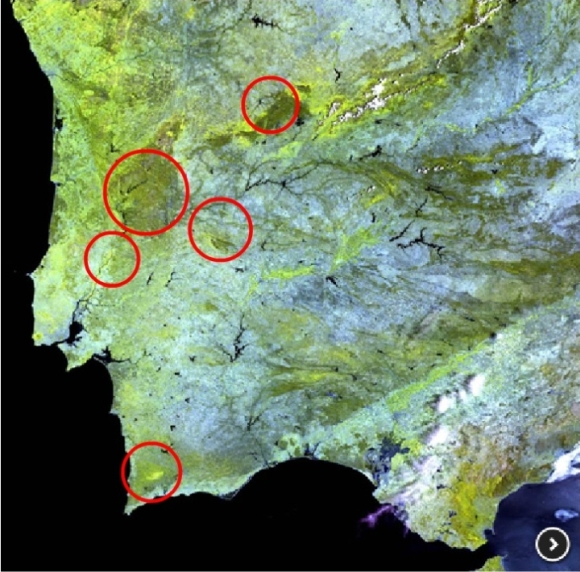
Fig 2.1 and Fig 2.2 - Image of Portugal taken with the MERIS instrument onboard ENVISAT on 18 June 2003 and 3 months later on 15 September 2003, respectively. The red circles mark the black, burnt areas.
The first and second days of August were the most severe days for forest fires, with a total burnt area of almost 160.000 ha. In Figure 2.3, taken from MODIS on 3 August, the hotspots of the fires are marked in red.

The air temperature was very high during this period, with maximum temperatures of just over 40ºC and minimum temperatures close to 30ºC (Figure 2.4). The continuous high temperatures and drought made the 2003 summer in Portugal especially severe and increased the potential for forest fires.

Fig 2.4 - Daily maximum and minimum temperature for Portalegre (39º17´44´´N 7º25´11´´W, 597m) in the centre of Portugal.
Question
Take a look at the following three surface charts, in which the red L represents low pressure areas and the blue H indicates the high pressure systems, and try to answer the following question. As forest fires typically occur on warm days when dry air masses are involved, can you think on what might have been the most favourable mean sea level pressure field for a severe forest fire event in Portugal?
The correct answer would be a).
This might seem hard to understand since you might expect rain and moist conditions with a depression just west of Portugal. However, be aware that the flow is decisive - with an easterly flow at the surface, the advected air is warmed and dried out over the Iberian Peninsula. This flow is driven by a high pressure system over the British Isles, France and the Bay of Biscay and by the surface low. This is a typical pattern of mean sea level pressure that is quite favourable for forest fires in Portugal!
But of course this is just at the surface and good meteorologists also check the conditions at other layers!
In fact, there is a persistent ridge in the medium levels over this already hot area. Subsiding air in the ridge is compressed by increasing pressure, the air warms up and thermal inversions are created. You can check the ridge at 500 hPa in Figure 2.5.

Fig 2.5 - Geopotential at 500 hPa. 2 August 2003 at 12 UTC
As you can see, a thermal inversion in the medium levels is also present in the tephigram of La Coruña, Spain in Figure 2.6.

In addition, the presence of a large pool of warm air over the Iberian Peninsula is clearly depicted by the temperature map at 850 hPa (Figure 2.7).

Question
Can you identify the range of temperature values at 850 hPa over the Iberian Peninsula on 2 August 2003 at 12 UTC?
The correct answer is B. The air temperature lies between around 22ºC and 26ºC at 850 hPa! These values are clearly above the mean for that area during summer months, which varies between 12ºC and 20ºC. In fact, temperatures over the Peninsula in that day are closer to mean values over the arid region in Northern Africa.

Fig 2.8 - ECMWF mean temperature at 850 hPa in June, July and August for the northern hemisphere between 1960 and 2000.