Chapter IV: Convective Parameters
Table of Contents
- Chapter IV: Convective Parameters
- HIRLAM
- Satellite Products: NWCSAF and MPEF
- Vertical Profiles
HIRLAM
In chapter 2 we have given you the set of basic and derived parameters from the ECMWF model. This chapter will go a bit more in depth in the topic of convection by presenting you a range of convective parameters from the HIRLAM model. In addition we also try to make the link in this direction by demonstrating you the potential of the various products from the NWCSAF and from MPEF. For latter we will show you the Global Instability Index product that uses a first gues of ECMWF and updates it with MSG information to retrieve a sounding and a stability analysis. Finally we this chapter will give some vertical profiles made over Mallorca and compare them with the forecasted soundings.
HIRLAM: Precipitation forecast
The model run from HIRLAM of 3rd of October 0000 UTC is the basis for the calculation of the total precipitation that was forecasted during the events of this case over the Iberian Peninsula and the Balearic Islands. These forecast images are shown in combination with the enhanced IR10.8 satellite image to make a comparison between model and real time imagery.
HIRLAM: Convective Parameters
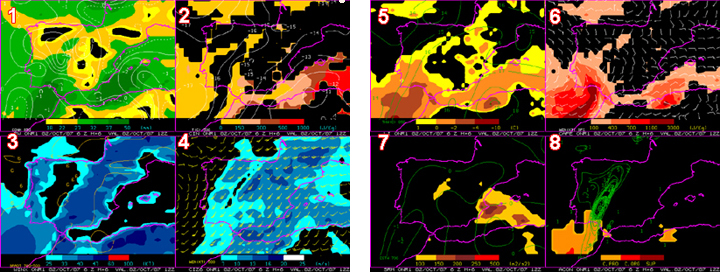
In the above two image there are 8 panels plotted that a forecaster in Spain has operational to see from the model where there is potential for convection. In this part of this chapter we will zoom in to this product and look at these different parameters from the HIRLAM model and describe the details we see in relation to this severe weather over the Balearic Islands. We will start with shortly identifying which these parameters are:
- PW, or precipitable water, is, in this interpretation of AEMET, the amount of liquid water, in mm, if all the atmospheric water vapour in a column from the surface to 300 hPa. were condensed. High values of PW in clear air often become antecedent conditions prior to the development of heavy precipitation and flash floods. When high PW values areas present a lifting mechanism and warm advection in low levels, heavy precipitation often occurs. These data can provide to forecasters an important tool for very short range forecasting.
- The opposite to CAPE is CIN which we also see plotted in the right image in the top right panel. CIN, which stands for convective inhibition is a numerical measure in meteorology that indicates the amount of energy that will prevent an air parcel from rising from a given level to the level of free convection. Sometimes is is also referred to as CAP or CAP inversion. There are many ways of compute CIN, AEMET's diagnostic tool takes an average parcel represented by first 100 mb of the atmosphere to compute it.
- The winx in the bottom left is derived from the WINDEX or Wind Index which is based on observations and numerical models and gives an estimation of max wind gust that can be generated by convective processes. It is considered that when a gust front moves perpendicular and towards high values of WINDEX contours, downburst activity has a chance to take place.
- CIZ6 is an indirect measure of vertical wind shear computed from the difference between the lowest 6 km mean wind and the lowest 500m mean wind. It is equivalent to twice the square root of the BRN shear, which is more widely use in forecast offices for the same purposes. The advantage of Ciz6 is that it offers to the forecaster values in m/s directly, (instead of m2/s2 given by BRN shear) which are more intuitive for the assesment task. According to most climatologies performed in the US, this parameter have a very good skill for discriminating organized convection: values between 12 and 24 m/s have to be taken into account for this pourpose. Values higher than 24 m/s tend to be detrimental for convective development, and values below 12 m/s tend to be not enough for well organized convection.
- Top left the Lifted Index is plotted. Negative values indicate potential buoyancy for a low level average parcel.
- Top right CAPE is plotted. CAPE which stands for (Convective Available Potential Energy) is a measure of the amount of energy available for convection.
- To the bottom left we see SRH which stands for Storm Relative Helicity. In this case SRH refers to storm relative helicity in the first 3km. It helps to estimate the capacity of a thunderstorm to produce rotating updrafts in a given environment. The computation is dependant on the direction and speed of the storm, so an approach has to be taken into account before computing it. In the case of AEMET diagnostic tool, the classical approach is adopted, that is to consider that the storm will move 30º to the right of the environmental mean flow and at a speed which is a 75% of that of the mean flow. A forecaster added value to this paramenter is straightforward by just changing the classical approach with the radar observed storm speed and direction, which would give much more realistic SRH values.
- Bottom right ACON is a combination of several convective parameters where different thresholds are set:
| Deep convection | LI<0; CAPE>600J Kg-1; CIN<300 J Kg-1 |
|---|---|
| Structurised deep convection | CAPE>700J Kg-1; CIZ>9 m s-1; RH (70 - 50 kPa)<60% |
| Supercell | CAPE>700J Kg-1; CIZ>9 m s-1; RH (70 - 50 kPa)<60%; SRH>150 m2 s-2 |
If you look closer you also see in some of the figures some lines and windbarbs plotted. This is the direct output from the model that provide guidance about the dynamics in the area of interest.
Nowcasting SAF products
Cloud Top Height
The cloud top temperature and height (CTTH), developed within the SAF NWC context, aims to support nowcasting applications. This product contributes to the analysis and early warning of thunderstorm development. Other applications include the cloud top height assignment for aviation forecast activities. The product may also serve as input to mesoscale models or to other SAF NWC product generation elements.
The CTTH product contains information on the cloud top temperature and height for all pixels identified as cloudy in the satellite scene.
Precipitating clouds
The objective of the PC product is to support detailed precipitation analysis for nowcasting purposes. The focus is on the delineation of non-precipitating and precipitating clouds for light and heavy precipitation, rather than quantifying the precipitation rate. Particular attention will be given to the identification of areas of light frontal precipitation.
The product provides probability results, i.e. probabilities of precipitation intensities in pre-defined intensity intervals. From the probabilities a categorical estimate of precipitation intensity may be derived. It is not intended to provide information on the type of precipitation.
Rapid developing thunderstorm
The Rapidly Developing Thunderstorms product is a tool for monitoring convection from MSG data and is used for early detection of storm clouds.
The basic objectives of the Rapidly Developing Thunderstorms product are twofold: the automatic identification, monitoring and tracking of intense convective systems as well as the detection of rapidly developing convective cells. In other words, this product aims to assist in the automated detection of convection clouds.
The convective systems are presented like "objects" within the satellite images together with their most relevant properties (size, movement, minimum temperature, area and temperature trends, etc.) generated for the expected significant weather. The product highlights the most active convective cells. It may also serve as input for the automated convection detection used in aviation meteorology.
The Rapid developing thunderstorm product is used during the early stages of thunderstorm identification - from the time when convective clouds form to the stage at which the cloud shield has developed at the vertical level of the tropopause.
Stability analysis imagery
Total Precipitable Water (TPW) is the amount of liquid water, in mm, if all the atmospheric water vapour in the column were condensed. High values of TPW in clear air often become antecedent conditions prior to the development of heavy precipitation and flash floods. When high TPW values areas present a lifting mechanism and warm advection in low levels, heavy precipitation often occurs. These data can provide to forecasters an important tool for very short range forecasting. Within the SAF NWC context, the main goal is to provide TPW data in clear air pixel by pixel in image format for Nowcasting purposes.
Stability analysis imagery
The Stability Analysis Imagery (SAI) was developed by the NWC SAF. The central aim of the SAI is to provide estimations of the atmospheric instability in cloud-free areas. Among all potential indices the Lifted Index (LI) has been implemented and codified and presented in this case for central Europe on the 19th June 2006. The lifted index of SAI is only done for clear sky conditions, therefor for SAI the first step is to compute the Cloud Mask product (CMa). This CMa allows the identification of cloud free and cloud contaminated areas. The SAI product itself uses the corrected normalized IR SEVIRI radiance values of the following channels WV6.2, WV7.3, IR8.7, IR9.7, IR10.8, IR12.0 and IR13.4μm), and provides as output the normalized lifted index.
GII
Global instability index (GII) is an airmass parameter indicating the stability of the clear atmosphere. The GII product should serve as a nowcasting tool to identify the potential of convection and possibly of severe storms in still preconvective conditions. The applied retrieval method makes use of six MSG SEVIRI thermal bands, and together with the a priori information of forecast profiles, the scheme infers an updated atmospheric profile for each MSG pixel, from which instability indices can be computed. Several instability indices are used in this case and presented. The images are presented in 1 hour sequence.
K-Index - Flash material not existing
The K-index is a widespreaded method amongst meteorologists to make a stability analysis of the atmosphere. In the above link the K-index as computed by the GII algorithm is presented in 1 hourly interval.
Lifted Index - Flash material not existing
A second index that is computed from GII is the Lifted Index. In 1 hour interval the Lifted Index is presented for the 19th June 2006 over Central Europa.
Precipitable Water - Flash material not existing
One final product to be presented is the precipitable water. For a Meteorologist this product can be of extreme value when doing a nowcast. It represents the total atmospheric water vapor contained in a vertical column of unit cross-sectional area extending between any two specified levels, commonly expressed in terms of the height to which that water substance would stand if completely condensed and collected in a vessel of the same unit cross section.
Vertical Profiles
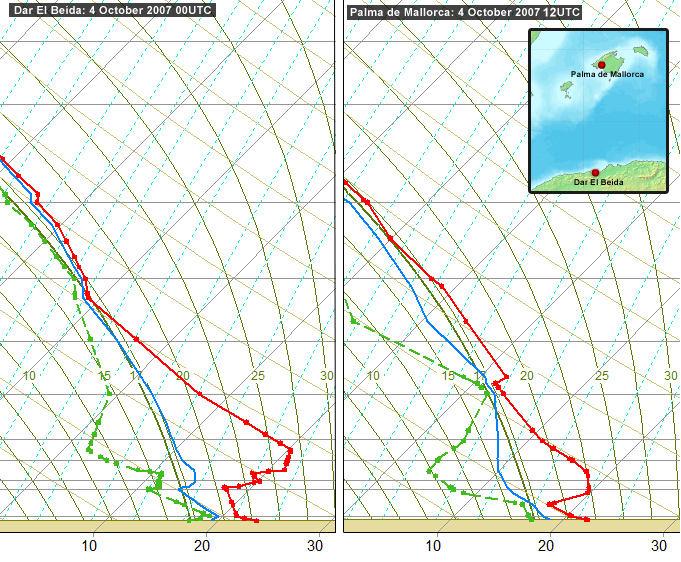
In the below image the observed sounding of Palma de Mallorca is plotted.
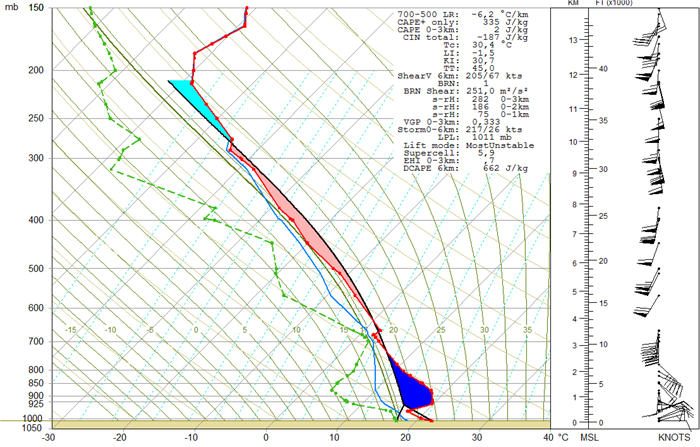
Figure 4.1: Observed sounding Palma de Mallorca. 4 October 2007 12UTC
Striking and main features are the:
- Presence of low level and deep layer shear, with a 70 kt southwesterly jet at around 5km
- Large convective inhibition, which will prevent initiation unless a significant forcing available. CIN will decrease with time as a result of low level advections. Also, a mesoscale forcing source will arrive in place at 15 UTC, as we know now, after the event.
- A shallow layer of latent instability near the ground, with no so large associated potential bouyancies (most unstable CAPE =MUCAPE=335 J/kg)
- Presence of an elevated mixed layer (EML) from 875 to 700 hpa (elevated source of African air, as pointed out in chapter 2 when the MODIS image comments)
The source of the EML can be traced back and confirmed by checking the sounding from Dar El Beida in Algeria. The sounding for 4th october at 00 UTC, confirms that the EML found in Mallorca at 12UTC is advected by a southerly and mid-level flow which is directed towards the Balearic Islands.
Relevant to this and to demonstrate the performance of the model we will show you the analysis of ECMWF for 12UTC and the +3 hour forecast for 15UTC for the sounding over Mallorca Bay (39.5°N, 2.6°E)
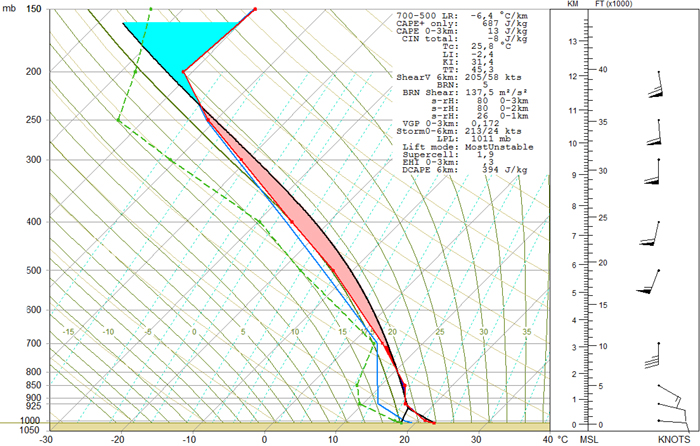
Figure 4.2: ECMWF analysis of 12UTC at Mallorca bay (39.5°N, 2.6°E). In red: temperature / green: dew point / blue: wet bulb temperature / black: most unstable parcel lifting path / 17.5 critical saturated adiabat outlined for clarification of latent instability layers
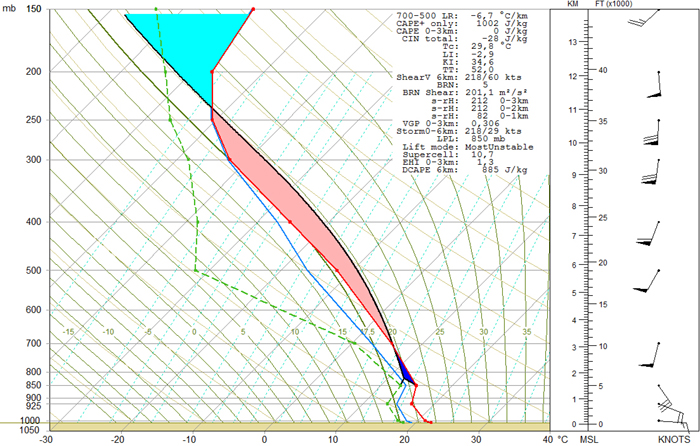
Figure 4.3: The 3 hour forecast valid for 15 UTC vertical profile at Mallorca bay (39.5°N, 2.6°E). The layer of latent instability is forecasted to increase markedly, mainly as a result of temperature and dew point advection at low levels
Regarding the three hours forecasted evolution of the vertical profile, two main features are clearly seen at low levels:
- A marked increase in depth of latent instability layer, as a result of positive advection of temperature and dew point at low levels. This is also reflected in the increase in MUCAPE value from 687 J/kg at 12 UTC to 1002 J/kg at 15UTC. Is important to stress here, that despite CAPE values are not impressive, there is a large number of parcels with moderate positive buoyancies, which is very relevant for the assesment of convection intensity.
- An increase in low level shear and helicity, as a result of the intensifying low level easterly flow, and also medium level southerly flow.
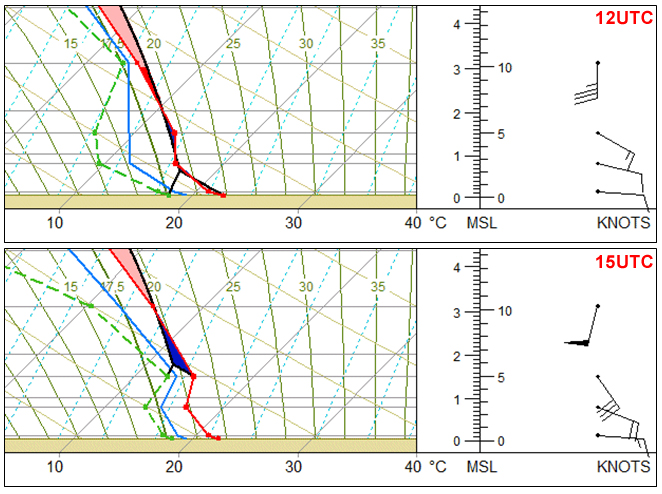
Figure 4.4: Zoom to the lower layers of troposphere. ECMWF analysis (12Z) (top) and 3 hour forecasted (15Z) soundings (bottom)
Verify that most unstable parcel at 12 UTC is at the surface, but at 15 UTC this parcel is at 850 hpa, where advections of temperature and humidity are forecasted to be larger (as a result of a marked increase of wind speed at this levels, from 15 to 30 knots).
NOTE: It should be taken into consideration that these profiles have been obtained from model output in standard pressure levels, so vertical resolution is not so high, and errors in convective parameters are to be expected. Still this model output is enough to show the main features we want to stress here.
At upper levels, we can also confirm the approaching of the jet streak from 12 to 15 UTC. The max winds are located around 9-10 km from MSL (see mesoscale analysis and forecast section). A corresponding increase in deep layer shear is also to be expected. For instance, forecasted BRN shear for 15 UTC is 202 m2 s-2, which is really a large value, implying that for convection to be sustained in this environment, a high degree of organization and intensity is required, otherwise, so much shear would be detrimental for the maintenance of convective activity.
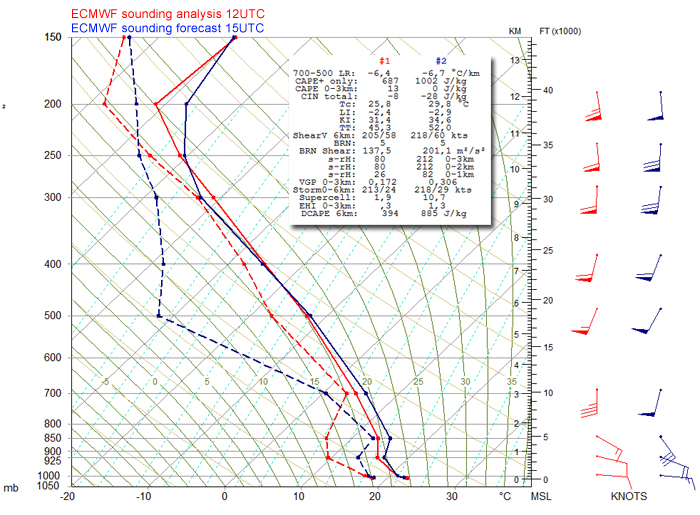
Figure 4.5: Comparison between the analysis and the three hour forecasted sounding of ECMWF.
Finally, although is not easy to interpret them for this case, we show a comparation of 12 UTC ECMWF run, analysis (left) and 3 hour forecasted (right) hodographs, at the same location as before (Lat, Lon) = (39.5N, 2.6E), and again calculated with standard pressure levels. Together with the hodographs, storm motion vector and storm relative winds are plotted.
For convective parameters computation, a storm motion vector has to be adopted, and here we follow the traditional approach, so the storm is supposed to move with 75% of mean flow speed and 30° to its right, which is not very realistic in this case, because our MCS, by 15 UTC, did not move to the right of the mean flow, even did not moved at the forecasted speed, but markedly faster.
Still, this simplified approach, give some insight on the evolution of kinematic convective parameters, that can be of use in an operational context in future cases and also, from the training perspective, we consider good idea to start using hodographs information as a side tool in the nowcasting proccess.
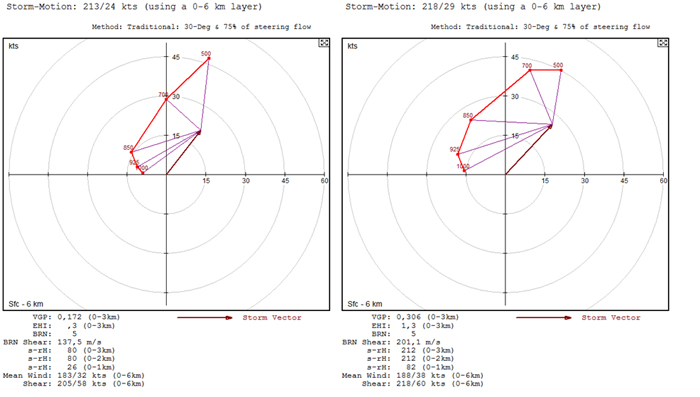
Please make note of the clockwise curvature of the hodographs, especially at low levels, in agreement with the low level warm advection, that allows for positive SRH values. Check that 3 km SRH is under-calculated by the software, because of the lack of two sampling points between 2 and 3 km height, so, obviously, a value much larger than 212 m 2 s-2 at 15 UTC should be expected. Because of similar reasons, 1 km and 2 km SRH's are also under-calculated. Regarding the 3 hours evolution of the hodograph, apart from the increase of SRH values, three other key ingredients are present:
- A marked increase in low levels storm relative flow by 15 UTC (size of the purple vectors)
- A marked increase in low level shear in layers 1000-925 and 925-850 hPa.
- A quite large streamwise vorticity at 1000 and 925 hpa (shear vector perpendicular to storm relative wind)
Allthough these three elements are considered necesary for tornadogenesis, obviously, their presence can never be taken as a predictor. Also, the environment attached to the arriving forcing source (the MCS gust front) can be quite different than the forecasted one, but this can not be assessed in this case study, because of the lack of radar derived wind information at low levels.