Chapter II: Basic and Derived Parameters
Table of Contents
- Chapter II: Basic and Derived Parameters
- Introduction
- MSG Satellite images
- Synoptic Analysis (ECMWF)
- Mesoscale Analysis (ECMWF)
Introduction
This chapter will present you a range of satellite images from MODIS and Meteosat 9 and a combination of these images with a set of basic and derived ECMWF parameters. Starting of which please have a look at the following MODIS image of 4th October 1143UTC. A mesoscale convective system can be seen in Figure 2.1 (Click to enlarge). The radar imagery (see radar chapter) suggest the presence of a Supercell thunderstorm in the southern flank of the MCS during its initial phase. A close look of Fig 2.1 even reveals some eminent signs of the severity of this cell as overshooting tops and some resulting gravity waves are visible. Towards the southern edge of the cell we can identify a fierce V-shaped structure.
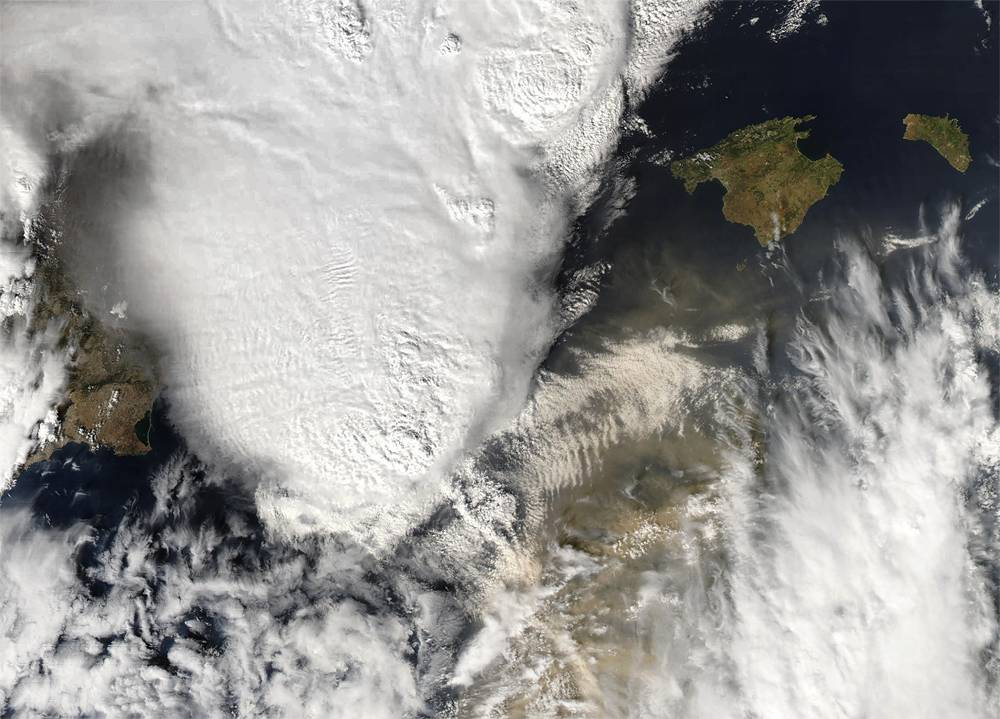
Figure 1: Modis image of 4th October 2007 1143UTC. The convective cell is evident at this stage with associated overshooting tops and due to the inflicting perturbation at the upper layers of troposphere also some gravity waves are seen.
Although we look at a static image it is possible to recognise different air masses. Each having its own characteristic helping us to solve the puzzle together to explain why the developments were so explosive.
- The image reveals there is a low level flow coming from the east "feeding" the MCS. This is best seen by the gravity waves observed east of the system.
- On mid-level flow a thickness ridge cloud from the Sahara is observed. It is observed a thick patch of clouds on the far right side of the image. Flanked by a dust cloud from the Sahara it is a sign of the southerly flow.
- The dust cloud also is the cause for a capped inversion. Continental African mid-level air over Mediterranean colder air, is supposed to produce a strong capped air mass, to the east of the MCS.
In the next three subchapter we will start to look at the different animations of satellite images and combine them with NWP.
MSG Satellite images
Meteosat 9 IR10.8 - Time sequence
In this series of images the convective developments over the Balearic Islands are described using plain Meteosat infrared 10.8 μm. The channel is appropriate as it pictures the ice particles from high clouds quite clearly. In a sequence of 15 minutes the relevant satellite image are presented.
Meteosat 9 Enhanced IR10.8 - Time sequence
In this chapter again Meteosat 9 infrared 10.8 μm is shown, but the images have been artificially color enhanced. This will improve the discrimination of where most ice particles form during the several convective stages. In a sequence of 15 minutes the satellite images are presented and described.
Meteosat 9 WV6.2 - Time sequence
The chapter presents the several convective developments over Mallorca using Meteosat 9 WV6.2 channel. The channel is suitable as it gives an idea of the upper tropospheric humidity (UTH) and gives a view of the upper air dynamics. 15 minutes sequence of images are presented.
Meteosat 9 HRVIS - Time sequence
This chapter will show the HRVIS images of 4th October. Especially with the smaller scale cells the high resolution channel allows us a very good monitoring of the convective development. In a sequence of 15 minutes the satellite images are presented and described.
Meteosat 9 Severe Convection RGB - Time sequence
The Severe Convection RGB makes use of the NIR1.6 and IR3.9 μm channels. Both of these channels provide information on the microphysics within the clouds. E.g. with this RGB we are able to discriminate between smaller and larger ice particles. This is useful for detecting convection. Cells that are bound to severe updraft will likely be characterised by smaller ice particles, as there is less time available for the ice particles to collide and form bigger particles. When a cell has reached its mature stage we will find larger ice particles. With this in mind click the above link and study the set of Severe Convection RGB images to identify at what stage the updrafts within the MCS is the highest and at what time step the cell reaches its mature stage.
Meteosat 9 Dust RGB - Time sequence
As the names says the Dust RGB is useful for detecting dust. Already in Fig 2.1 (Modis image) we could recognise the presence of dust. However using this RGB is also very helpful when looking at convection. You will learn that with this RGB you can easier discriminate between the thick ice part of a convective cell and the anvil which is a thin cirrus shield.
Synoptic Analysis (ECMWF)
Meteosat 9 with ECMWF Overlay (Synoptic scale) - Flash material not existing
This subchapter presents the set of ECMWF parameters combined with the satellite image. The interactive overlays gives you the freedom to combine and study them. A short description on the most interesting features is given to provide you with some extra guideline.
Mesoscale Analysis (ECMWF)
Although ECMWF is not a mesoscale model, we found it of interest to zoom in into the area of interest to have a more detailed, full resolution view, of different relevant parameters that helps to understand which mesoscale processes could have played a major role in this convective event.
Meteosat 9 HRV with ECMWF Overlay (Meso scale) - Flash material not existing
The subchapter on the mesoscale situation shows you for 12 and 15UTC the HRVIS images in combination with the following ECMWF parameters; 1000, 925 and 850 hPa streamlines, Mean Sea Level Pressure, Isotachs at 700 and 300 hPa and the potential temperature at 700 hPa. The interactive overlays gives you the freedom to combine and study them. A short description on the most interesting features is given to provide you with some extra guideline.