
Hydrology & water management
Listed here are other resources related to Hydrology & water management tag:
Note: click on an image to open the Resource
Bob Adler talks on TRMM/GPM rainfall for landslide prediction.
Length: 35 minutes.
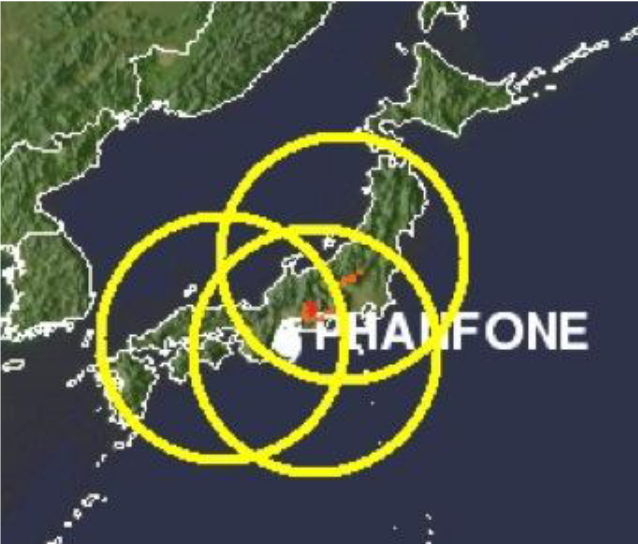
A Global Flood Monitoring System (GFMS) has been developed and tested to provide real-time flood detection and streamflow estimates using NASA multi-satellite precipitation data calibrated by TRMM and, in the near future, by the GPM core satellite. Images and output data are available for use by the disaster relief and science communities with updates available every three hours (http://flood.umd.edu). The system currently uses the TRMM Multi-satellite Precipitation Analysis [TMPA]) and a hydrological and routing combination model, the Dominant river Routing Integrated with VIC Environment (DRIVE) system. The land surface and runoff calculations are carried out at 0.125 latitude-longitude resolution with routing and streamflow calculations done at that resolution and also at 1km resolution. Examples of results for recent flood events will be presented, including calculated inundation maps compared to those estimated from MODIS data. Results from a system to estimate landslide potential are also available at (http://trmm.gsfc.nasa.gov/publications_dir/potential_landslide.html). Landslide examples will also be shown.
Evaluation of the flood system against a global flood event archive indicates skill for longer duration floods in terms of Probability of Detection (POD) [~ 0.8] and False Alarm Rates (FAR) [~0.6]. False alarms are often associated with the presence of dams (not accounted for in the system at present), but sometimes with overestimates of rainfall or artifacts (false rain) related to surface conditions (e.g., cold/wet ground). Failures of detection are often related to underestimation of rainfall, frequently due to shallow, orographic systems unseen or underestimated due to lack of a strong scattering signal in the passive microwave observations.
Claudia Riedl presents an automatic land slides warning system for Austria.
Length: 28 minutes.
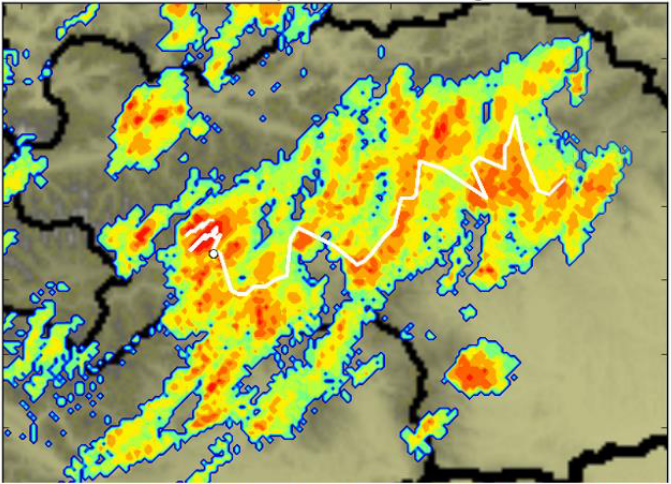
Extreme rainfall events leading to landslides in torrent catchment areas in Austria will be analysed due to their intensity, extent and duration using weather maps, satellite images, data from weather stations, INCA analysis and thunder cell tracking algorithms. And a meteorological early warning system concerning landslides will be introduced. This system uses short term precipitation forecasts and predefined thresholds for sending a SMS or Email to the user.
Gregor Gregoric presents satellite-derived vegetation indices for Slovenia.
Length: 39 minutes.
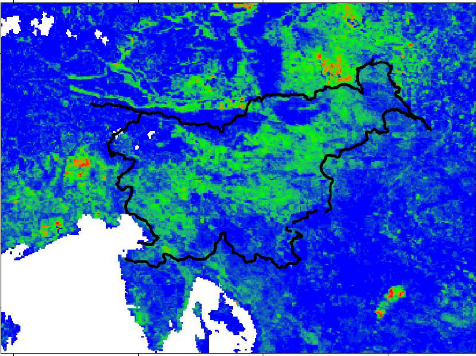
Various sources of vegetation indices data (EUMETSAT LSA SAF, Copernicus Land Monitoring Service and MODIS) are available for drought monitoring in Slovenia. Each source has its advantages and disadvantages; the EUMETSAT LSA SAF data is updated daily (it is based on 15 minutes measurements), however it has relative coarse ground resolution (approx. 5x5 km over Slovenia). On the other hand Copernicus Land Monitoring service uses data from low orbital satellites which allow finer ground resolution (500 m - 1 km), but data are refreshed only every 10 days (similar frequency is valid also for MODIS data).
Regarding indices, vegetation signal from Fraction of Vegetation Cover (FVC) and Leaf Area Index (LAI) have been found to be a very good indicators of vegetation condition. FAPAR based on LSA SAF data gave us less accurate information on vegetation status. Our main focus is devoted to selected location with relative homogeneous vegetation and intense agriculture. Interpretation of drought signals deduced from indices time series is done with help of the reference period data and drought is interpreted as departure of current condition from reference values. However, drought influence can be masked with signals of damaged vegetation due to severe weather, e.g., hail; therefore much more effort needs to be invested in analysis that a drought signal can be recognized and isolated.
Javier Garcia presents LSA-SAF products and applications for drought monitoring.
Length: 35 minutes.
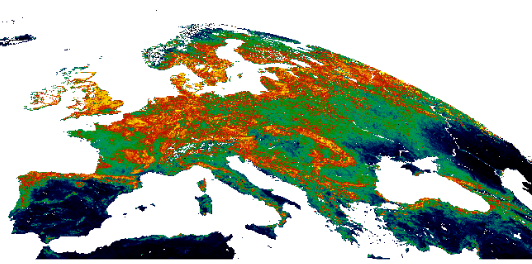
The LSA SAF generates and disseminates Fractional Vegetation Cover (FVC), the Leaf Area Index (LAI) and the Fraction of Absorbed Photosynthetically Active Radiation (FAPAR) products derived from SEVIRI/Meteosat BRDF data for the whole Meteosat disk on a daily and 10-day basis. The high rate of acquisition provided by the SEVIRI instrument guarantees the availability of spatially consistent cloud-free data for adequately monitoring both the seasonality of vegetation and the long-term trends in the state of vegetation. This presentation is structured in two parts. Firstly, it is provided an overview of the algorithms, and main characteristics of the VEGA products, including some details about the continuous validation. Secondly, insights about the utility of the products for different applications related with land cover dynamics are also provided, particularly for near real time drought monitoring.
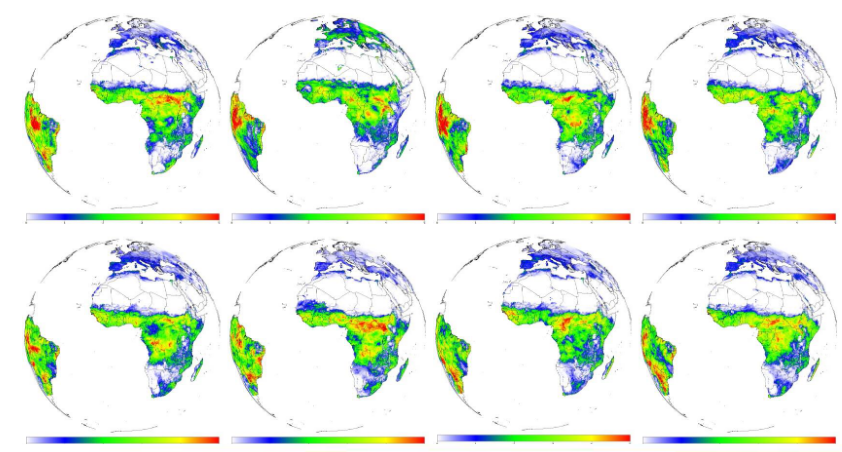
Felix Kogan reports on drought detection from satellite data.
Length: 31 minutes.
Drought is one of the most adverse environmental disasters. It affects countries’ economies, environment and population wellbeing. Drought occurs every year somewhere in the world and is very costly disaster. Only in the USA, the country of high technology, drought costs taxpayers nearly $6 billion each year. Unlike other environmental disaster drought is a very unusual phenomenon because it starts unnoticeably, develop cumulatively, the impact is also cumulative and by the time when the effect of drought is observable it is too late to mitigate the consequences. Drought was traditionally monitored by weather data. However, since global weather station network is limited, satellite data were used for drought detection, monitoring, prediction and impact assessment. NOAA has developed new method for drought detection and monitoring from reflectance measured by the Advanced Very High Resolution Radiometer flown on NOAA polar-orbiting operational environmental satellites. The method calculates Vegetation Health (VH) indices, which estimate vegetation condition (health) on a scale from extreme stress to favorable conditions based on intensity of greenness, vigor and hotness of vegetation canopy. The VH is estimated every week for each 4 by 4 km earth surface since 1982 and is delivered to the NOAA/NESDIS web site in digital, color-coded and time series from http://www.star.nesdis.noaa.gov/smcd/emb/vci/VH/index.php. In addition to drought and vegetation health monitoring, the VH indices are applied to model and predict agricultural production, wild fire risk, mosquito-borne diseases, climate & land cover changes, invasive species and others. This presentation provides some principals of the method, current drought situation, example of global and regional early drought detection, estimation of its intensity, duration & impact, modelling & prediction of crop production, and explains possible climate services. Some attention will be devoted to drought impacts on food security and how the new generation of NOAA operational satellites (S-NPP/JPSS) will improve drought detection and monitoring.
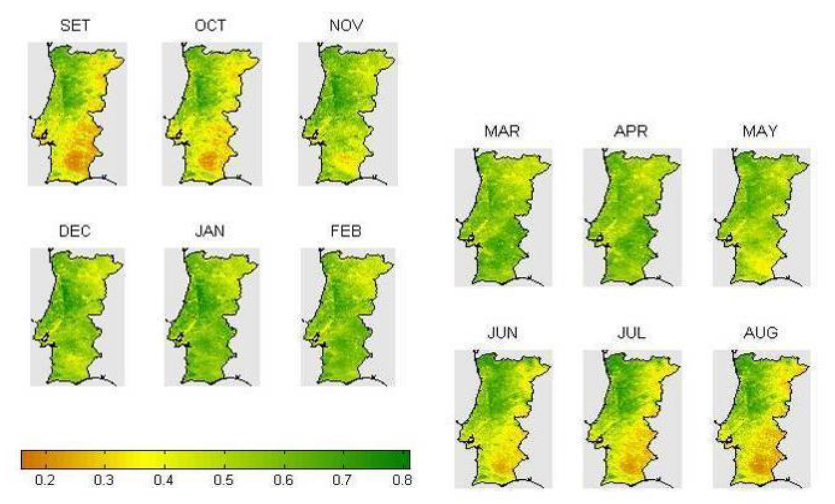
Celia Gouveia evaluates drought events with help of vegetation and drought indices.
Length: 32 minutes.
Currently the determination of the ecological, agricultural and environmental impacts of climatic change is considered to be a scientific priority. In the present context of climate change and increasing land degradation and desertification, the evaluation of drought impacts is crucial in determining the environmental consequences of a hypothetical change in climatic conditions.
In the last decade special attention was devoted to the development of new indices particularly suited for drought analyses, quantification and monitoring, namely the ones that are using evapotranspiration data.
On the other hand remote sensing data allows to analyse vegetation activity and to estimate different biophysical parameters such as the area index, the vegetation biomass, the net primary production and photosynthetic activity. Given the spectral properties of vegetation, vegetation indices can be calculated and used to analyse vegetation dynamics and climate impacts, namely to determine the impact of droughts.
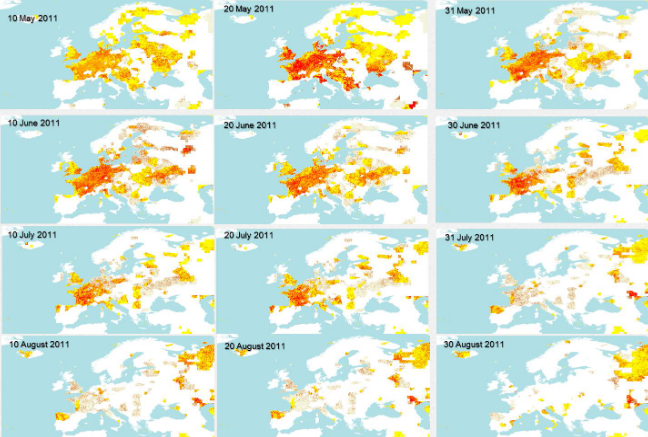
Guadalupe Sepulcre presents indicators for drought in Europe.
Length: 45 minutes.
The European Drought Observatory (EDO) (http://edo.jrc.ec.europa.eu) is an initiative of the European Commission’s Joint Research Centre that aims to integrate drought information at European level in a platform accessible to everyone. This information consists mainly in indices based in meteorological and remote sensing data that are produced in near real time.
During this lecture, the different indicators produced operationally at EDO will be firstly introduced. Secondly, a study developed at EDO assessing the LSA-SAF Evapotranspiration (ET) product for drought monitoring in Europe will be detailed. In this analysis, two case studies will be presented; corresponding to the drought episodes of spring/summer 2007 and 2011. For these two cases, the drought indicators previously introduced (Including ET) will be compared and analyzed, considering in the analysis, different drought effects as it is the decrease of the agricultural production.
Finally, the main limitations of the ET as drought indicator will be discussed, as well as the potential for drought assessment and monitoring of other LSA-SAF products like the Land Surface Temperature (LST) and the fraction of Absorbed Photosynthetic Active Radiation (fAPAR).
Nicolas Ghilain presents products of the LSA-SAF.
Length: 45 minutes.
Water resource is a major concern for sustainable development in many semi-arid areas. Early detection of drought and monitoring water consumption by agriculture are highly important for adaptation in water use regional policy. As a crucial component of the water cycle, land evapotranspiration is a primary source of information for such water resources assessments, and remote sensing from geostationary satellites offers the possibility to monitor it over large areas at relatively high temporal and spatial resolutions. The Satellite Application Facility on Land Surface Analysis (LSA-SAF) of EUMETSAT proposes an operational evapotranspiration product based on data from the SEVIRI instrument of the Meteosat Second Generation (MSG). This SESSION will focus on the evapotranspiration process and the role of satellite-based remote sensing to its observation over land. More particularly, the strategy adopted by LSA-SAF to produce the evapotranspiration maps will be unveiled, with an overview of the quality and characteristics of the operational products. At last, some examples of the product utility in drought monitoring will be given.
Zuhal Akyurek reports on snow reflectance characteristics that have to be considered in snow detection from satellite data.
Snow on the ground differs from most of the Earth surfaces by its high reflectance or albedo in the visible and near-infrared wavelengths (0.350 to 1 μm). For longer, the snow’s reflectance decreases significantly. In these wavelengths,snow is even less reflective than certain types of vegetation. Most of the incident radiation in these wavelengths is absorbed in the snowpack. These unique spectral characteristics are used in optical remote sensing to distinguish between snow and other types of surfaces. The numerous validation studies indicate that the satellite snow products have large snow mapping accuracy with respect to ground snow observations for cloud-free conditions, which varies between 69 and 94% in the winter seasons. The main limitation of existing optical platforms operating at a daily timescale is cloud coverage, which significantly reduces the availability of snow cover information.
In this session, algorithms used to retrieve HSAF snow products; snow mask (H31, H34) and effective snow cover area (H32, H35) from opticalsatellite data are presented. The challenges and the opportunities in retrieving snow cover mapsfrom optical data are discussed.

Ali Nadir Arslan gave an overall introduction of the H SAF products with a focus on snow detection.
The operational goal of H SAF highlights the need to provide products with a reliable measure of their accuracy, so the potential users are made aware of the advantages and drawbacks of the use of the H SAF products in their operational activities. With this aim, within the H SAF, three Validation Groups have been established: one for precipitation, one for soil moisture and one for snow products.
An overview of existing and future satellite-derived snow products will be provided.

Silvia Puca gave an overall introduction of the H SAF products.
In the first part of the session an introduction to the EUMETSAT HSAF project is made. The EUMETSAT Satellite Application Facility on Support to Operational Hydrology and Water Management (H SAF) started in 2005 and aims to provide remote sensing estimates of relevant hydrological parameters: instantaneous rain rate and cumulated rainfall, soil moisture at surface and in the root zone, snow cover and water equivalent. The project involves experts from 12 national meteorological and hydrological European Institutes of Austria, Belgium, Bulgaria, Finland, France, Germany, Hungary, Italy, Poland, Romania, Slovakia and Turkey, and from the European Centre for Medium-range Weather Forecast (ECMWF).
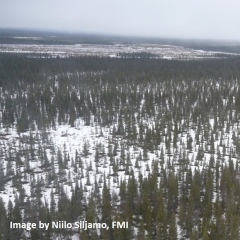
Kenan Bolat reports on H SAF snow detection product H34 that is derived from the SEVIRI instrument on-board MSG H34 differs for flat and mountainous regions.
H34 is a snow mask product, which is retrieved from optical imaging radiometer Spinning Enhanced Visible and Infrared Imager (SEVIRI) mounted aboard the geostationary Meteosat Second Generation (MSG) satellite operated by EUMETSAT. MSG/SEVIRI provides continuous imaging of the earth in 12 spectral channels with a repeat cycle of 15 min. The imaging spatial resolution is 3 km at sub-satellite point and degrades to 5 km over Europe. The snow cover mapping is based on a multi-channel retrieval algorithm. It exploits the high reflectivity of snow in the visible spectrum and the low reflectivity at shorter wavelengths. The snow cover retrieval algorithm differs for flat and mountainous regions. Considering the different characteristics of snow for mountainous and flat areas, two different algorithms are used in producing the snow products for flat and mountainous areas, and then the products are merged to have a single snow product.