
Dry airmass
Dry sinking air masses appear red in the Airmass RGB images.
The reddish color is an indication for a day air mass, mostly resulting from sinking processes. This phenomenon can often be observed at or near ongoing cyclogenesis. Potential Vorticity (PV) is a good indicator for this dynaic process. So called "PV anomalies", i.e. a local height minimum of the 1.5 PV-value surface indicate the downward motion of dry stratospheric air. The 1.5 PV-value surface is often considered as the "dynamical tropopause".
As the air is getting dryer when sinking compared to the surrounding air masses, both the WV6.2 and the WV7.3 channels exhibit rather high values of the brightness temperature (BT). Still the BT of channel WV7.3 is a little bit higher than from channel WV6.2 as the latter is more affected by water vapour absorption. The BT difference (BTD) WV6.2-WV7.3 is smaller within dry areas than outside, and hence the contribution of the red colour beam is large.
The stratospheric air is ozone rich, hence the BT of IR9.7 low, the BTD IR9.7-IR10.8 strongly negative. Therefore, the impact of the green colour beam is low.
The contribution from the blue colour beam is rather small, if not zero. The temperature scale for channel WV6.2 is chosen such that high BT give only little contribution to the blue colour beam.
The Airmass RGB image below shows a reddish area over Scotland and the North Sea. A cyclogenetic process is ongoing.
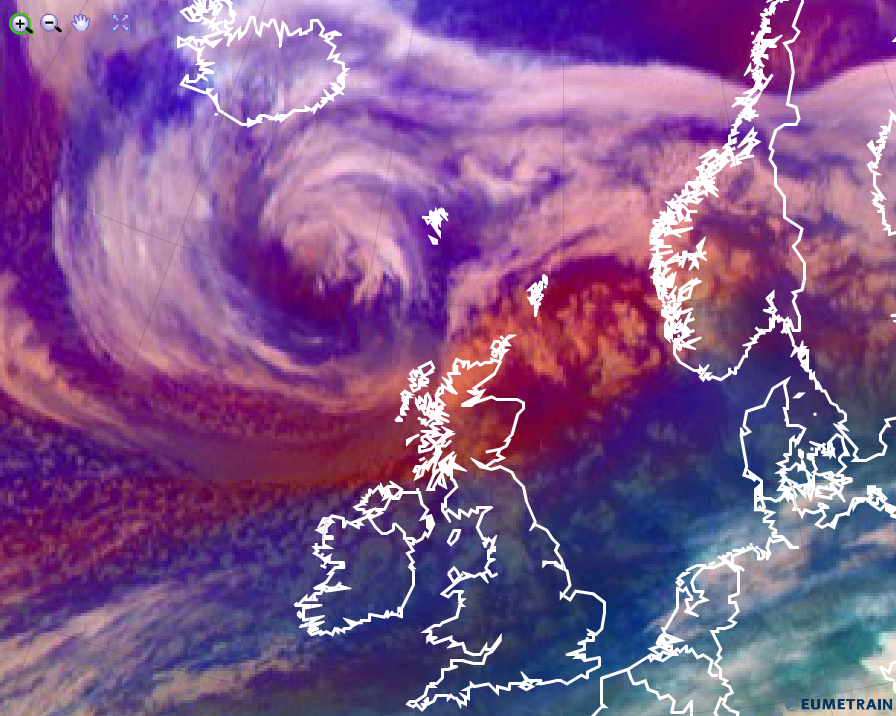
Airmass RGB for 13 January 2016 12:00 UTC
The Airmass image below shows a red zone over the Arabian peninsula (10th May 2012 at 06:00 UTC). In tropical and subtropical regions the Airmass RGB depicts hot and dry air masses in red-orange tones. The dryness of the air is due to missing moisture supply from the desert and not because of dynamic effects.
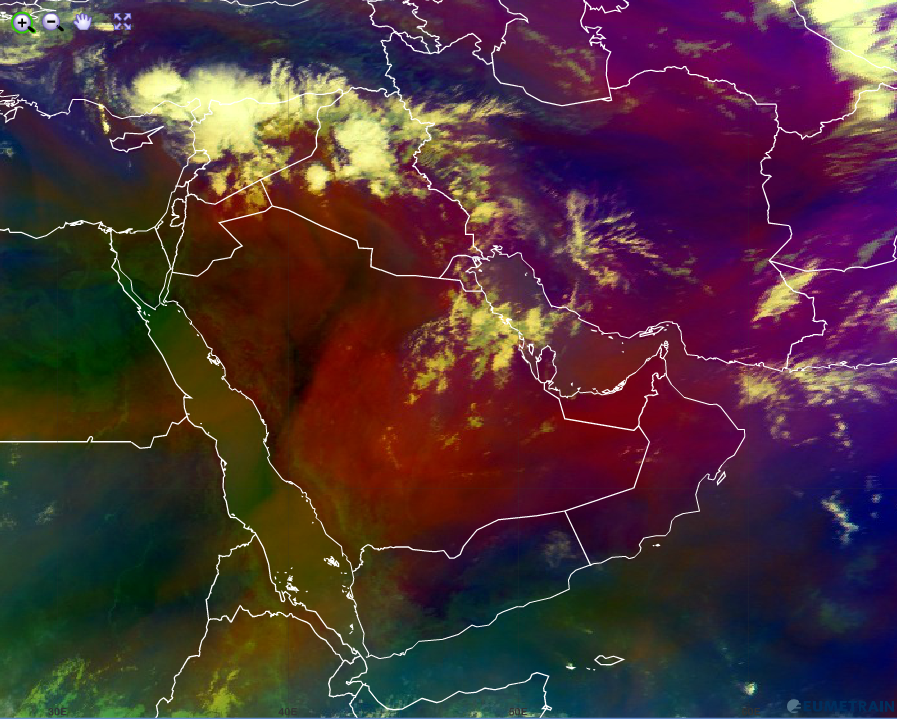
Airmass RGB for 10 May 2012 06:00 UTC
Explanation of the red colour of dry air masses in the Airmass RGB (see the recipe):
• Dry air masses are characterised by their reddish colour in the Airmass RGB. This results from a combination of a low tropopause level (cold airmass) and high ozone concentration in the level of highest instrument sensitivity in combination with strong radiances in both WV channels.
• In warm air masses, red/orange areas depict dry and hot air.