Synoptic environment
This catastrophic event occurred within a tropical airmass, with high moisture amounts throughout the whole troposphere. The RGB air mass (Figure 2) depicts this environment, showing high thick clouds over the island at 6 UTC, in the beginning of the event. The green shades to the south, are clearer air areas of tropical characteristics, while to the northeast, the brownish shades depict the polar air area, with a clear intrusion of stratospheric air. The Wet Bulb Potential temperature at 850 hPa (Figure 3) improves an environment analysis, showing the related "tongue" of warm moist air over the Atlantic in red and orange shades.
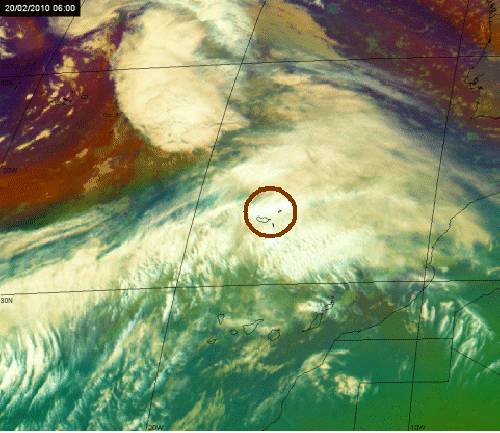
Figure 2: Meteosat 9 Air mass RGB on 20/02/2010 at 06 UTC.
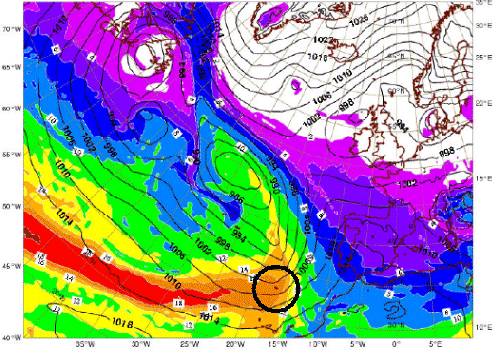
Figure 3: ECMWF analysis of Wet Bulb Potential temperature at 850 hPa on 20/02/2010 at 12 UTC.
The temperature and dew point vertical profile of Funchal radiosounding confirms that the whole tropospheric layer was very moist up to around 340 hP (Figure 4). The Total Precipitable Water ECMWF analysis shows values in excess of 40 mm close to the island at 12 UTC (Figure 5), which is in close agreement with the radiosounding TPW estimated value of 36.7 mm.
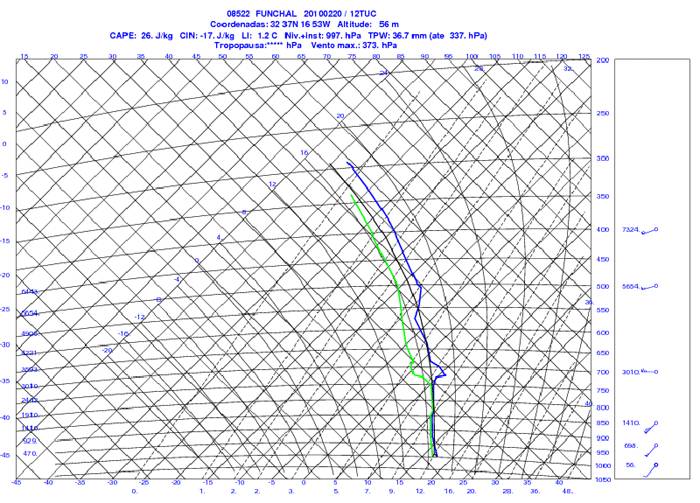
Figure 4: Funchal Radiosounding on 20/02/2010 at 12 UTC.
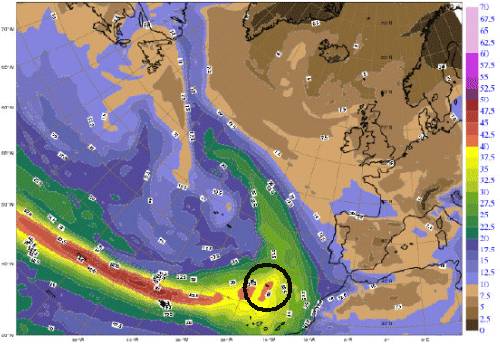
Figure 5: ECMWF analysis of Total Precipitable Water on 20/02/2010 at 12 UTC.
Furthermore, the unstable nature of the air mass is also retrieved both from observation/imagery and model analysis. The severe storm RGB at 12 UTC (Figure 6) shows the existence of many active individual convective cells around the island (younger cells in yellow pixels). In fact these cells formed over the area where the analysis of the Jefferson index shows values in excess of 30�C (Figure 7), and that pretty much fits the whole area of higher values of TWP and Wet Bulb Potential temperature at 850 hPa, referred above.
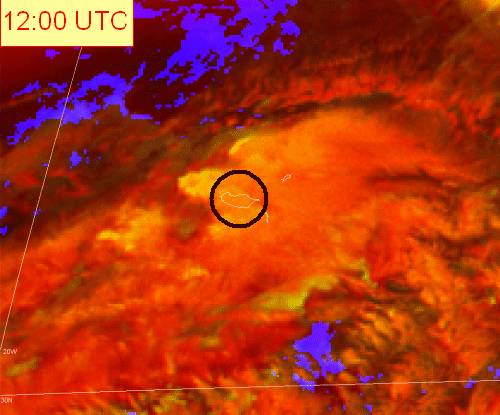
Figure 6: Meteosat 9 Severe Storm RGB on 20/02/2010 at 06 UTC.
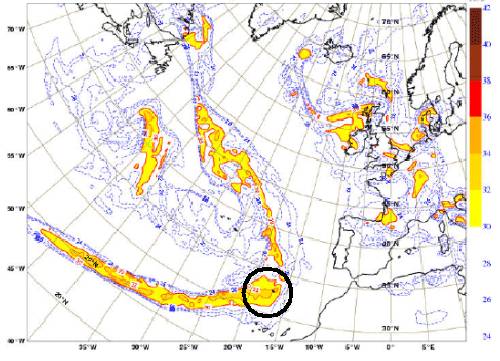
Figure 7: ECMWF analysis of Jefferson Index on 20/02/2010 at 12 UTC.