Cloudiness structure and PBL process
Comparison of Natural Colour RGB or HRV Cloud RGB satellite imagery with model-inferred lapse-rates shows that several regions with different stratification could be found south of the cyclone's centre, which are also recognizable in the character of the cloudiness. The strongest gusts occurred in the region with a neutrally stratified (well-mixed) PBL (Fig. 5.1). There were shallow convective water clouds in this area with tops at around 2 km height. The neutral stratification was at least 300-700 m deep. At the PBL top, the wind speed was comparable to (or higher than) the magnitude of the strongest gusts along the windstorm path. The gusts therefore originated from turbulent transfer of momentum from these levels.
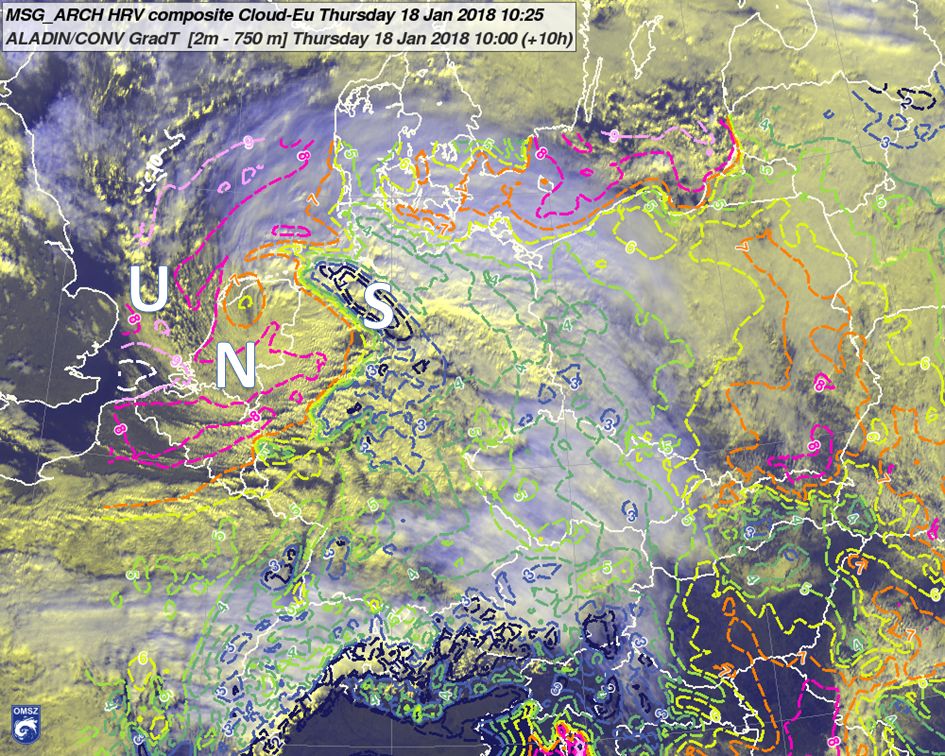
Figure 5.1: METEOSAT HRV Cloud RGB (background) on 18 January, at 10:25 UTC, and ALADIN model forecast of the lapse rate between 2 and 750 m height (lines), valid for 18 January 10:00 UTC. High lapse rates can be found over the southern and central part of Netherlands, where the highest 925 hPa wind was forecast (compare with Fig. 4.4). The Bulk Richardson number calculated for the lowest 300 m layer (not shown) indicates that the stratification was almost neutral (N) and the lower part of the boundary layer was well mixed. This can be accompanied by high turbulence and transport of momentum within a layer several hundreds of meters deep above the surface (at 300-700 m heights the wind speed was comparable to the speed of the strongest observed gusts). Conditionally stable (S) stratification occurred in the WCB region (but only close to the surface). Unstable (U) stratification was found over the North Sea.
In the cold-frontal area, a series of parallel cloud bands (cloud streets) appeared with short-wave patterns at their top (Fig. 5.2). The numerical models suggested conditionally unstable stratification up to 700 hPa topped by a stable layer (and dry air). The presence of this inversion, accompanied by strong wind, could be related to the observed wave generation (trapped lee waves). Deeper (nearly 4 km high) clouds occurred at the end of the cyclone's head, where the near-surface stable stratification was replaced by conditionally neutral or slightly unstable stratification aloft. Convectively induced downdrafts also occurred here.
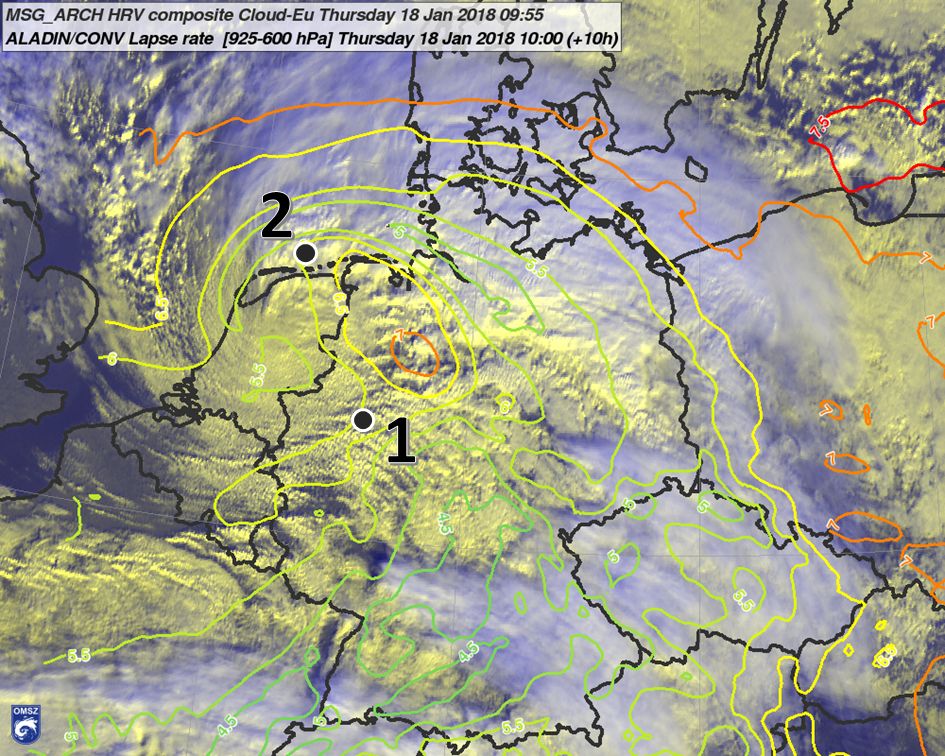
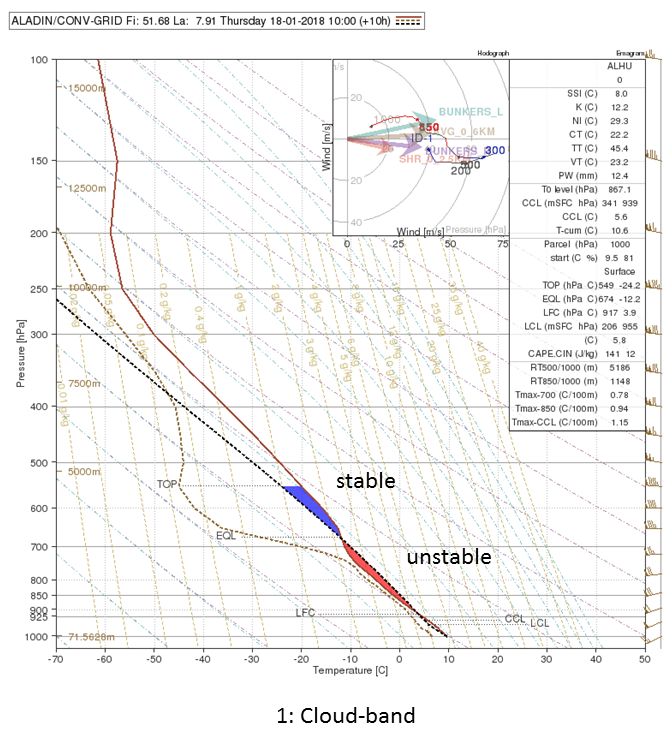
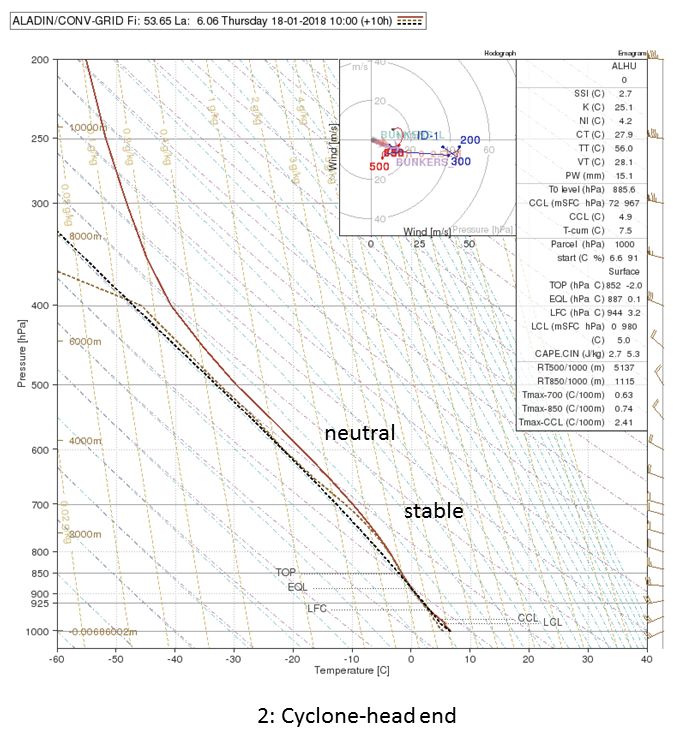
Figure 5.2: The stability conditions in the cyclone were rather complicated, as illustrated in these images. We investigated two points (marked on the satellite and 925-600 hPa lapse rate image in the top panel). The first point represented the environment of the cloud bands in the neighbourhood of the cold front (point 1). These resembled cloud streets but were deeper (with tops about 3 km high) and produced weak precipitation. The pseudo-sounding (lower left image) showed conditionally unstable stratification between 925 and 700 hPa levels topped by a stable layer. The gravity waves seen on the top of these clouds were related to this stable layer and strong winds. Another location with an interesting environment was the end of the cyclone's head (point 2, lower right image), northeast of the warm core. Deep (at least 4 km high) clouds could be observed in this area, where the stratification was stable between 900 and 700 hPa but became neutral, or slightly unstable, aloft.
The importance of the PBL processes and turbulence in the environment of intense cyclones can also be illustrated by other cases. For example, on 29 October 2017, severe wind gusts occurred over Hungary, behind a propagating cold front. This area was relatively far from the cyclone's centre (Fig. 5.3), so the presence of strong gusts (up to 130 km/h) obviously did not fit the classic sting jet concept. Although thunderstorms developed at (or just ahead of) the cold front, the peak gusts occurred in a conditionally stable stratified area, 30-40 kilometres behind the front. The high-resolution numerical model AROME suggested an extension of the very high wind speeds to the top of the PBL, with high TKE (Turbulent Kinetic Energy) below. It is also very likely that in this case the strengthening of the wind at the top of the PBL was supported by descending motion (on the order of 0.5-1 m/s) in a strongly baroclinic but conditionally stable environment. Similarly, to the Friederike case, this wind strengthening was also accompanied by advection of dry air at mid-levels. The intense turbulence resulted from both high wind shear and low static stability below the area with high winds.
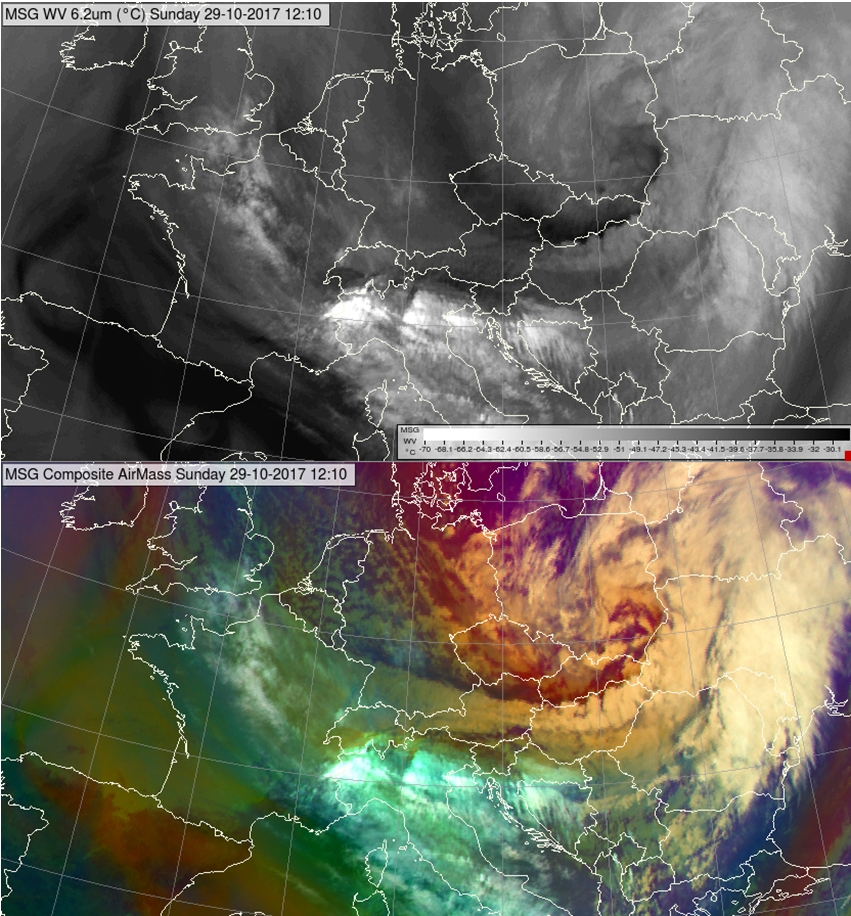
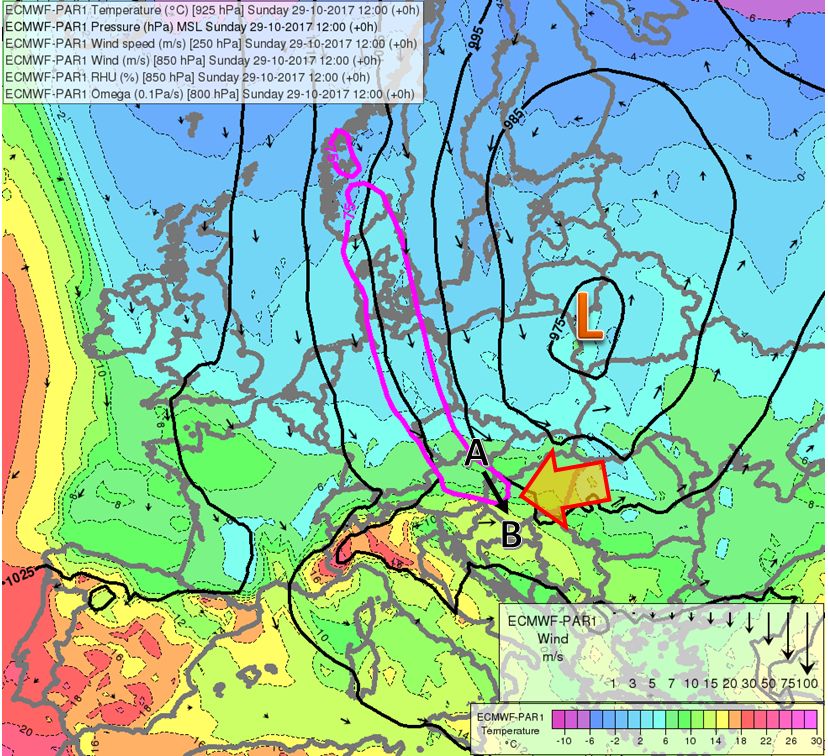
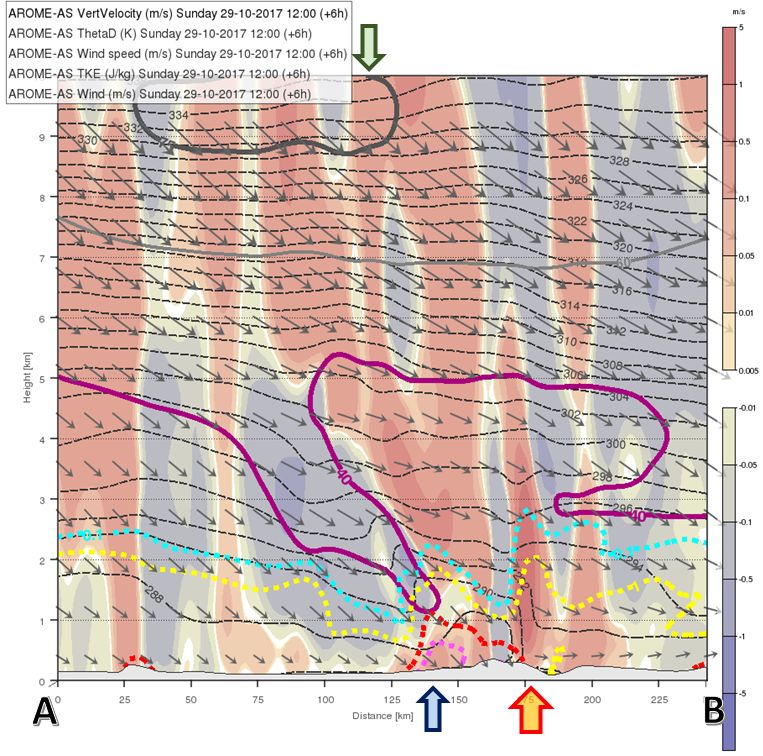
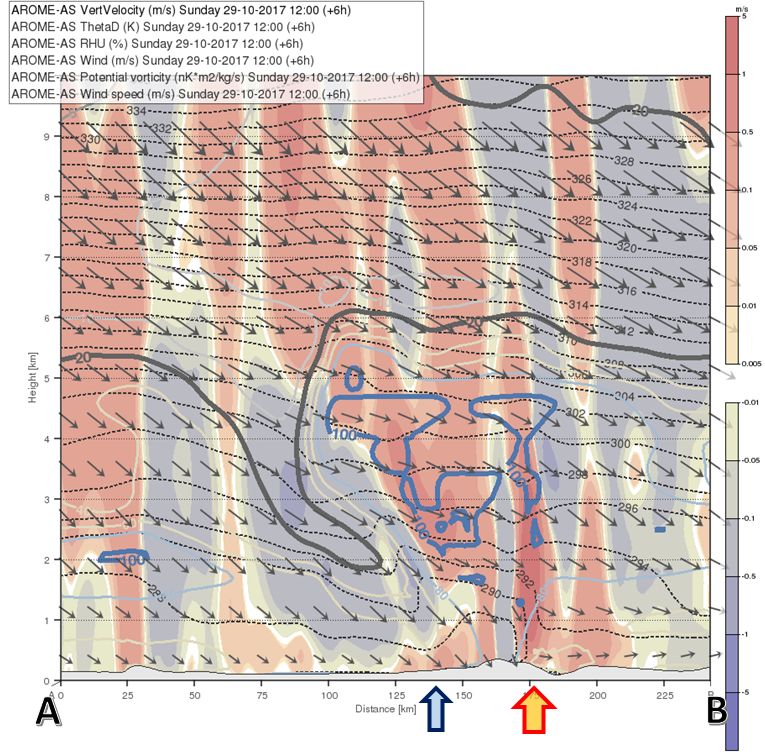
Figure 5.3: a) Top left: SEVIRI WV6.2 and Airmass RGB image for 29 October 2017 12:10 UTC.
b) Top right: ECMWF analysis of 925 hPa temperature (shades, °C), mean sea level pressure (lines, hPa), 850 hPa wind (arrows, m/s) and 250 hPa wind speed (magenta line at 75 m/s), valid for 29 October 2017 12 UTC. The arrow points toward western Hungary, where the windstorm was the most intense and where the AB cross-section of AROME model output is located. The magenta 75 m/s isotach shows the position of the jet-streak, while the letter L emphasizes the position of the cyclone's centre (hundreds of km north-eastward from the windstorm).
c) Bottom left: Vertical cross-section (position shown on panel b)) through the fields of vertical velocity (shades, m/s, bluish for downward, reddish for upward motion), wind speed (thick coloured lines at 40, 50 and 75 m/s), potential temperature (thinner dashed, black lines, K) and turbulent kinetic energy (TKE, thick coloured dotted lines at 0.1, 1, 5, 7.5 J/kg). The large red arrow points toward the location with deep convection ahead of the cold front. The smaller blue arrow shows the location where the strong wind approached an area with high TKE in the planetary boundary layer. The green arrow points toward the position of the upper-air jet.
d) Bottom right: as in c) but with wind speed replaced by relative humidity (20% line is dark grey and 100% line is blue).