
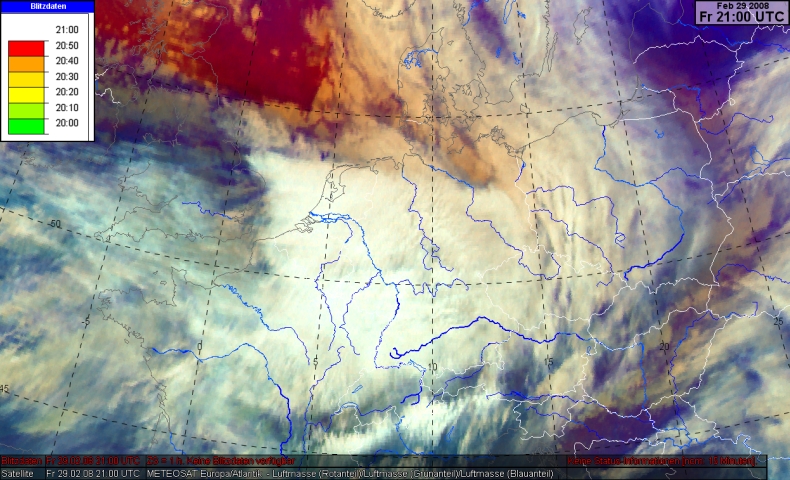
This chapter presents the lightning detection during the last 60 min in combination with the airmass-RGB. The meaning of the colouring of the lightning markers is given in each image. For more information about the saellite images' colouring click upon legend or click upon the key symbol (above).
By clicking through the time steps the movement and development of the thunderstorms can be observed.
We will investigate the position of the lightning detection in relation to the airmass composite. This will give us information about dynamical processes yielding convection during the passage of the cold front and succeeding convective line. The lightnings shows us the convective line's intensity and velocity.
The airmass-RGB reveals over Scotland and the North Sea a purple area of high PV and an overrunning jet. The latter can be seen from the pink-brownish coloured clouds over the Southeast North Sea to North Germany. Because this area moved fast to the east-southeast dynamical forcings in its forefield are likely.