
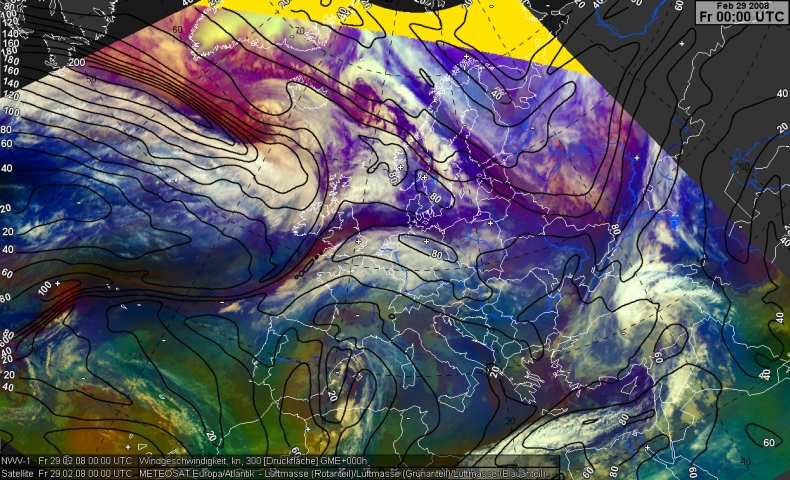
This chapter contains the combination of wind speeds in 300 hPa and the airmass composite (see legend).
We will investigate the positions of jet axis and corresponding dynamical processes The wind in 300 hPa represent normaly the jet axis quite well. Due to the vertical tilting of the jet axis some (small) deviations between the maximum model wind in 300 hPa and real jet axis may exist, despite some weaknesses in the model simulations. Regardless these possible problems, we will call the maximum wind in 300 hPa "jet axis" or "jet".
This image reveals over the Northwest Atlantic a strong jet with more than 200 kt wind speed that fits well with the long and line orientated transition from purple colour to blueish area. The surface low was situated at its left exit.