
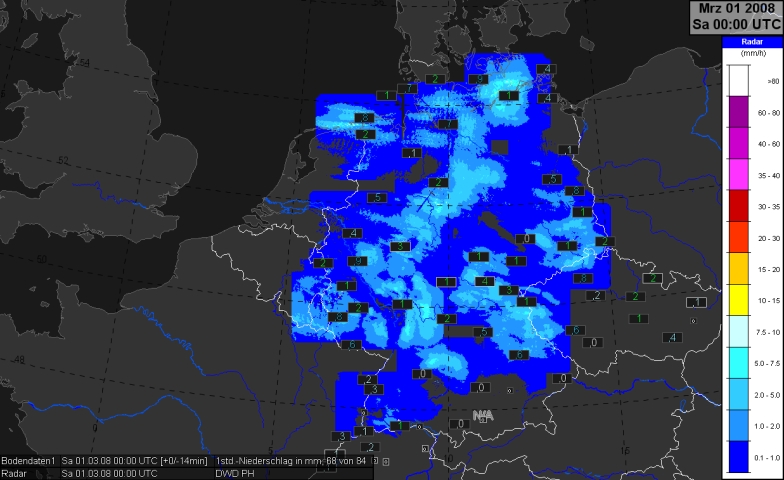
This chapter presents the precipitation amounts of the last hour (derived from the DWD-radar network and from local measurements). The colours indicate the precipitation amounts according to the radar data (the corresponding legend at each picture, click upon the key-symbol, above).
The radar data enable us to get a more detailed overview of the precipitation amounts although they may exhibit some errors. One problem during approaching colder air (as it happened in this case study) is the so-called bright-band effect. Due to technical reasons, sleet and graupel/hail exhibits relatively high reflectivities in the radar images. Because the precipitation amounts are derived from the reflectivity in 1 km height we may get high precipitation amounts which are not realistic.
During the last hour, at many regions of Germany precipitation up to 10 mm/h occured (based upon radar). However, we will only concentrate upon the precipitation in relation to the cold front and the succeeding convective line.