With this chapter we will consider the potential instability in relation to the vertical motion in 500 hPa. We will use the CAPE. First hints to thunderstorms are CAPE> 300 to 400 (for Middle Europe and summer, no numbers available for other seasons). If we find an area of potential instability superimposed by upward motion convection is likely.
Because the vertical motion fields from the local model are rather difficult to interpretate the fields from the global model is used because they are smoother.
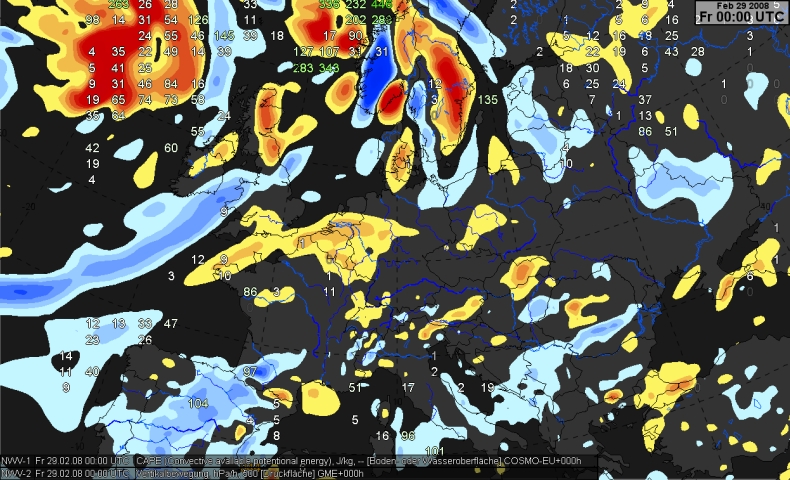
Upward motion (Omega<0) are indicated in yellow to red areas (red means stronger upward motion). Light to dark blue areas means downward motion. Unfortunatley, no suitable legend is available.
That means values of at least 300 in combination of red areas are indications to thunderstorms or strong convection.
The relevant area is west of UK (upper left corner) with CAPE up to 261 and upward motion. We will only concentrate upon this structure. The others will not be discussed.
In this chapter some relations to the significant weather will be considered. Please click upon the link below.