Background and Scientific Problems
On the basis of the continuous progress in satellite technology there is a wide selection of different imageries available. However the detection of volcanic ash clouds, especially their height and concentration, can be very challenging. When ash clouds are masked by other clouds the detection gets even more complicated.
The eruption of Eyafjallajökull on 14 April produced an enormous amount of water vapour, which finally ended up as ice cloud. Therefore in the beginning the ash signal was masked by ice clouds. After a few hours the ice sublimated, whereas the ash particles remained. This can be detected for example in the Dust RGB, where the ice clouds are marked in black and the ash clouds show a reddish/orange colour (see Figure 2.1).
Figure 2.1: Meteosat 9 Dust RGB - 15 April 2010 from 0000UTC to 1330UTC.
It should be further noted that satellites can only detect ash clouds with certain concentration. This means that lower concentrations could be present elsewhere. Therefore regions near visible ash clouds can be affected as well and have to be considered when warnings are issued.
Between the 19 April and 18 May the German aerospace center (DLR) performed 17 measurement flights between Southern Germany and Iceland for probing plumes. Layers of volcanic ash were detected by LIDAR and probed in-situ with aerosol instruments. The LIDAR detected several layers of higher particle content at altitudes between 3.5km and 6km (see figure 2.3). In the plume layers particles larger than 3 micrometers were detected at concentrations, not present in the free troposphere under unpolluted conditions. Moreover these concentrations are comparable to situations when Saharan dust plumes are present. Under suitable viewing conditions, the ash layer was visible as brownish layer (see Figure 2.2). The measurement flighs were directed to regions up to 1 mg/ m-3 ash concentration and stayed there for several minutes. Despite an average ash concentration of more than 0.2 mg/ m-3 on the flight routes, the subsequent analysis of the engines revealed no clear damages.
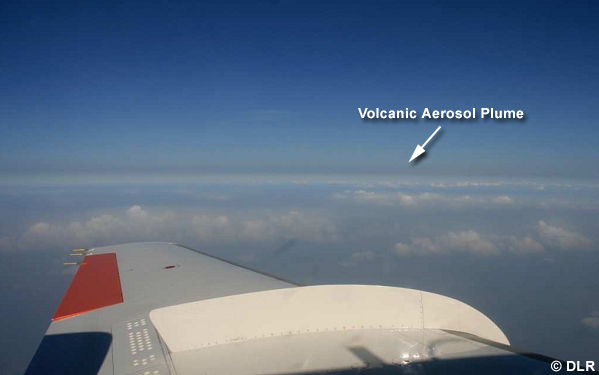
Figure 2.2: Picture taken on board of DLR Falcon near Leipzig on 19 April 2010. Source: DLR
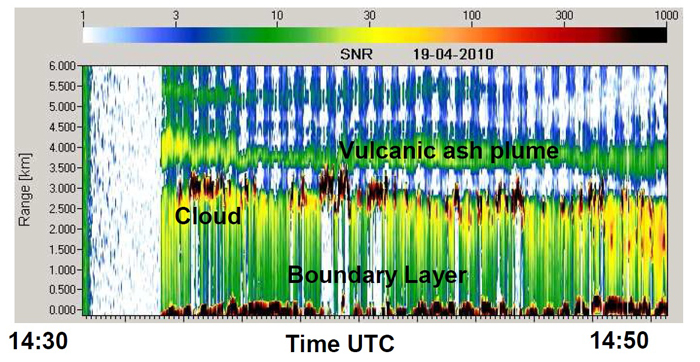
Figure 2.3: Quicklook from 2μm lidar measurement from Falcon flight on April 19, 2010 showing Signal-to-Noise Ratio shortly after take-off from Oberpfaffenhofen from 14:30-14:50UTC going north during 20 minutes (about 200-240 km flight track); red/black colors show high SNR from clouds (around 3 km) and ground (0 km); blue/green colors show layers with aerosol: white/blue colors indicate noise (no valid data); 2 layers of higher aerosol level are visible at 4 km and 5.5 km. Source: DLR
A comprehensive overview of the results of the LIDAR measurements can be found in the report of the DLR (U. Schumann, Report of Falcon Flight 19 April 2010 DLR-Report). Moreover a joint analysis of the eruption of Eyjafjallajökull in April 2010 has been done by several European aviation experts. This report was recently published in the journal of Atmospheric Chemistry and Physics (ACPD-Report).
Although measurement flights provide high quality data, the data set is often restricted to certain flight tracks and cannot account for the whole domain. Therefore additional methods have to be found to assess the impact of ash clouds. For this purpose numerical dispersion models such as the Lagrangian particle dispersion model are being used. For the calculation of the trajectories of the particles, the initial conditions (wind- and temperature fields), the height of the ash column as well as the initial time of eruptions are needed (see chapter 4).
Nevertheless the dispersion models can just provide an estimation of future conditions and include a certain range of uncertainty. The communication of this range of uncertainty can sometimes be very challenging. Considering the situation on the 14th of April there was remarkable controversy regarding aviation hazards. However the best assessment of volcanic ash clouds includes closely monitoring satellite images and a profound knowledge of the related dispersion model.