
Identify surface features
Overview on the H SAF satellite derived snow products.
Reliable snow cover extent is of vital importance to have a comprehensive understanding for present and future climate, hydrological, and ecological dynamics. Development of methodologies to obtain reliable snow cover information by means of optical and microwave remote sensing (RS) has long been one of the most active research topics of the RS community. Operational snow products namely H10 (Snow detection (snow mask) by VIS/IR radiometry), H11 (dry/wet by MW radiometry), H12 (Effective snow cover by VIS/IR radiometry AVHRR), H13 (Snow Water Equivalent(SWE)by MW radiometry), H31 (Snow detection by VIS/IR radiometry), H32 (Effective snow cover by VIS/IR radiometry AVHRR) have been developed since 2008 within HSAF. Considering different characteristics of snow for mountainous and flat areas, various algorithms are used in producing the snow products for flat and mountainous areas, and then the products are merged to have a single snow product. The development of new snow products is in progress. The presentation will provide an overview of existing and future operational satellite-derived snow products of H SAF portfolio. In the last part of the presentation, there will be a short introduction of quality assessment. After a brief recap of all available operational and pre-operational products, the performances of the products and the new validation strategy using high-resolution satellite data will be discussed, with some interesting case studies of the latter.
Lecture slides (Arslan and Akyurek)...
Overview on the H SAF satellite derived precipitation products.
The EUMETSAT Satellite Application Facility for Operational Hydrology and Water Management (H SAF) provides satellite products and user services in support to Operational Hydrology, Meteorology, Risk Management and Water Management. Since 2005, H SAF science and research bridge into operations through the development and dissemination of soil moisture, precipitation and snow products based on the exploitation of primary EUMETSAT missions. During the fourth Continuous Development and Operations Phase (CDOP-4, from 2022 to 2027), H SAF products will be primarily based on the Meteosat Third Generation (MTG) and the EUMETSAT Polar System -Second Generation (EPS-SG) missions. Current products are based on the use of the full constellation of microwave (MW) radiometers for Level 2 passive microwave (MW) precipitation products and for MW/IR combined products for near-real time applications over the Meteosat Second Generation (MSG) full disk area. The presentation will provide a full overview of the current status and future development of the operational precipitation product portfolio as well as the product quality assessment strategy and results. Examples of applications for specific case studies will be also presented.
Lecture slides (Panegrossi)...
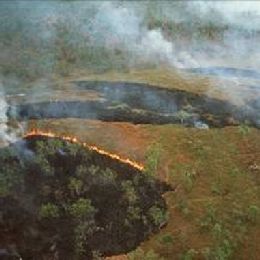
This webcast contains 2 presentations: The first is from Lourdes Bugalho who talks about the forest fire combined risk index (ICRIF) and the second presentation is from Renata Libonati about monitoring burnt areas from polar orbiting satellites.
First part:
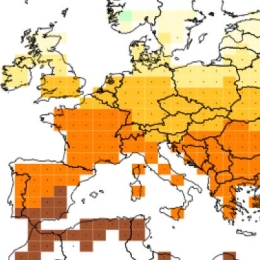
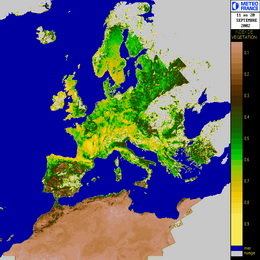
Forest fires are one of the most devastating natural disasters that often occur in mainland Portugal during the summer, with an impact on the economy, environment and climate. The Institute of Meteorology, currently Portuguese Institute of the Sea and the Atmosphere (IPMA, Instituto Português do Mar e da Atmosfera) has long made efforts to provide daily information on the risk of forest fires. Currently, IPMA daily runs an index of forest fire risk based on FWI (Fire Weather Index), developed by the Canadian Forest Service. This new index, ICRIF (Indice Combinado de Risco de Incêndios Florestais ) combines FWI with the type and condition of vegetation, called structural risk, being the vegetation type based on CORINE 2000 (CLC2000) and the vegetation conditions based on daily observation of NDVI (Normalized Difference Vegetation Index), retrieved from the AVHRR radiometer.
Second part:
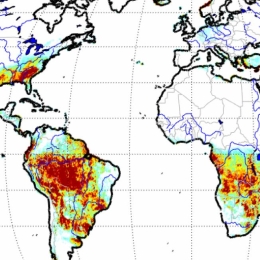
Brazilian Amazonia together with the adjacent savanna (Cerrado) presents a huge number of fire events every year. In such context, accurate information about location and extent of burned area is required and of particular interest for the scientific communities dealing with meteorological and climate models in what concerns reliable estimations of biomass burned. Accordingly, an effort has been made by the scientific community to develop thematic products of burnt areas. In such context, this presentation will provide an overview of INPE/Brazil currently efforts in monitoring burned areas. The initiative is based on the (V,W) burned index. The index uses daily reflectance obtained from the 1km MODIS Level 1B calibrated radiance from bands 2 (NIR) and 20 (MIR). An overview will be given of results obtained and operational applications will be shown.
Go to Webcast (first part from L. Bugalho) ...
Go to Webcast (second part from R. Libonati) ...
Powerpoint (first part from L. Bugalho) ...
Powerpoint (second part from R. Libonati) ...
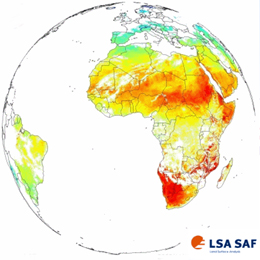
The scope of LSA-SAF is to increase benefit from Satellite (MSG and EPS) data related to land, land-atmosphere interactions and biospherical applications.
The main purpose of the Land SAF is to increase the benefits from MSG and EPS data related to land, land-atmosphere interactions and biophysical applications, namely by developing techniques, products and algorithms that will allow a more effective use of data from the two planned EUMETSAT satellites.
Although directly designed to improve the observation of meteorological systems, the spectral characteristics, time resolution and global coverage offered by MSG and EPS allow for their use in a broad spectrum of other applications, namely within the scope of land biophysical applications.
Activities to be performed within the framework of the Land SAF shall involve the development of products that are especially relevant in the following fields of application:
» Weather forecasting and climate modelling, which require detailed information on the nature and properties of land. Highest Land SAF priority should be towards the meteorological community and, within that community, NWP has been already identified as the one that has the greatest potential of fully exploit the products;
» Environmental management and land use, which require information on land cover type and land cover changes (e.g. provided by biophysical parameters or thermal characteristics);
» Natural hazards management, which requires frequent observations of terrestrial surfaces in both the solar and thermal bands;
» Climatological applications and climate change detection.
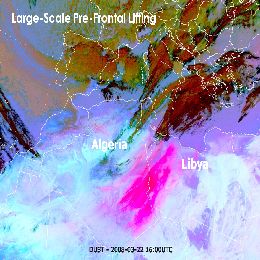
Presentation on how to discriminate levels of dust and what are the global impacts of dust outbreaks.
Dust is a global issue with it\'s good and also less good sides. There are hundreds or even thousands of places on Earth where the dust can be lifted, nevertheless you need to have a dust source to create a dust outbreak. And these are indeed two needed ingredients for lifting dust in the air that must come together; strong surface winds (requires about 15 knots) and dust source (or hotspots). MSG satellite helps a lot to do much better hot spot climatology, and for that, product called Dust Microphisics RGB is widely used. It is derived from three MSG spectral channels. Red color corresponds to difference of channels IR12.0 and IR10.8, green color to the difference of channels IR10.8 and IR8.7 and blue color to the sole IR10.8 channel. In addition to this product Natural Color RGB is also used, but mostly for detection of dust outbreak over the ocean. In this lecture Jochen Kerkmann, from EUMETSAT, will try to describe dust source regions and dust climatology, how to detect better dust on satellite images, how to discriminate levels of dust and what are the global impacts of dust outbreaks. Also he will mention topics like synoptic patterns and diurnal cycles of dust outbrakes, cloud-dust interaction, forecasting of dust movement and will give a list of typical mesoscale phenomena that can cause dust outbreaks.

Lecture based on the detection of forest fire hot spots by satellite means, which is more important in regions with small population covered areas.
Forest fires, as a natural phenomena (e.g. ignited due to lightning), is important factor in natural living process of a forest. Nevertheless, problems occur because most of the forest fires are caused by a human action, thus are very difficult to predict in any form. Therefore this lecture is mainly based on detection of forest fire hot spots by satellite means, which is more important in regions with small population covered areas. Emphasis here is on the IR3.9 µm SEVIRI channel, which can be called window channel, but on the other hand it is close to a CO2 absorption band. The importance of this channel we can see through a Wien's law; 3.9 µm is peek wavelength of blackbody with temperature of around 750 K, which is very close to temperature of a fire flame during active phase of fire. Besides forest fire detection, in this lecture you can hear something about detection of aerosols coming from forest fires, identification of burnt areas and about Fire Risk products.
Lecture starts with explanation of Vegetation monitoring and some applications of Vegetation products, such as NDVI index, FVC index, LAI and FAPAR indices.
The new generations of sensors on board meteorological satellites (SEVIRI -MSG, ASCAT -EPS, etc. ) enabled a whole new range of products related to the properties of the surface. Applications of such products are great. Some of them are; Vegetation monitoring, Wild Fires detection, Floods and Heat waves monitoring, detection of Urban heat islands, Crop water requirements, etc.
Lecture starts with explanation of Vegetation monitoring and some applications of Vegetation products, such as NDVI index, FVC index, LAI and FAPAR indices. After that Evapotranspiration parameter and Reference evapotranspiration overview is given. And at the end Land surface temperature is observed and various applications of this product are discussed.

This one hour presentation takes focus on the characteristics of the product files that are produced and distributed by LSA SAF.
This one-hour presentation takes focus on the characteristics of the product files that are produced and distributed by LSA SAF. The structure of the files is explained and freeware tools are presented. All the relevant information is given for the obtaining LSA SAF products. More general product information is given for documentation and file structure of data. Also, this session is explaining how to use Quick visualization by means of HDFView, GIS tools for visualization and analysis (Quantum GIS, GRASS GIS and ILWIS) and tool for georeferencing LSA SAF products. At the end of presentation there are words about how to use Python scripting for building custom scripts or programs for accessing and manipulating Land SAF data.

Evapotranspiration is a parameter closely related to vegetation state and stress. This session will show how this quantity is obtained within the LSA SAF.
Evapotranspiration is a parameter closely related to vegetation state and stress. This session will show how this quantity is obtained within the LSA SAF. Evapotranspiration is estimated using a land surface model forced with radiation and vegetation variables obtained from SEVIRI measurements. Very interesting Resistance scheme of this model is nicely explained using deviding image pixels into \'tiles\' of homogeneous vegetation types. Input and output of this model is also mentioned. Presentation is showing validation and incomparison of results together with possible applications of it.
Presentation giving an overview on the use of satellite data, particularly that from Meteorological satellites, for monitoring vegetation cover and properties.
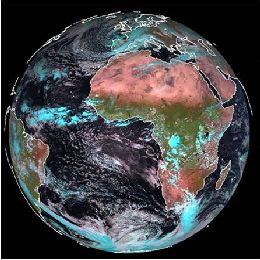
The current presentation gives an overview on the use of satellite data, particularly that from Meteorological satellites, for monitoring vegetation cover and properties. Some basic physical principles are first presented and then some RGB images are shown, allowing to identify different features in the surface of the earth. Further information on vegetation is given by a wide range of empirical indices, from which one of the most used is the NDVI. There are however some disadvantages on using such vegetation indices. Other parameters more related to vegetation properties and health than these conventional empirical indices are available from the LSA SAF. These are the Fractional Vegetation Cover (FVC), the Leaf Area Index (LAI) and the Fraction of Absorbed Photosyntetically Active Radiation (fAPAR). The algorithm rationale for deriving such parameters is explained and some validation results are presented. Finally, the use of these products in several applications is shown.

Discussion is held on various techniques of mapping burnt areas from remotely sensed data, describing the main sources of errors and strategies to overcome them.
Discussion is held on various techniques of mapping burnt areas from remotely sensed data, describing the main sources of errors and strategies to overcome them. Focus of first part of this session is so-called Fire Detection and Monitoring (FD&M) product, which provides continuous monitoring of fire activity over Africa and Europe. This product relies on Fire Detection Algorithm called FiDAlgo (based on so-called contextual algorithms), is an operational procedure that allows active fire detection in near-real-time and is based on information from Meteosat-9, i.e. SEVIRI instrument.
The second part will present applications to the analysis of burnt scars and vegetation recovery, with case studies for the Iberian Peninsula. Operational product for tracking burnt areas LSA-SAF still doesn't have, but presentation gives perspective of rising such. Very simple model for post-fire vegetation recovery is presented and are shown correlations between post fire vegetation recovery dynamics and severity of fire damage.

Presentation during the event week on Snow in January 2010.
Hannes Rieder from ZAMG, Austria who will provide a presentation on the interesting forecasting challenges associated with avalanches in Styria.