Comparison with SEVIRI Day Microphysics RGB images
The METOP AVHRR Day Microphysics RGB will be compared with the standard SEVIRI Day Microphysics RGB, which uses a different channel (IR3.9) for its green component.
However, in the case presented in Fig. 13 it is compared to the non-standard SEVIRI RGB. It is created with the same recipe, but using the SEVIRI NIR1.6 channel as the green component. This comparison is done to show that the AVHRR NIR1.61 channel is very similar to the SEVIRI NIR1.6 channel and as a consequence the two RGBs are also similar. The differences are due to the different satellite viewing angles.
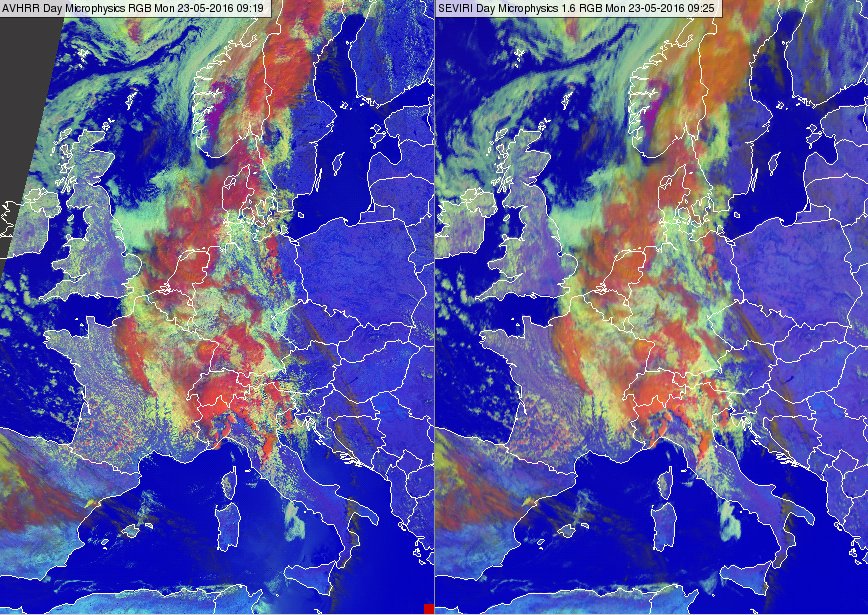
Figure 13: METOP-B AVHRR Day Microphysics RGB (left) and Meteosat SEVIRI RGB created with the same recipe and using the SEVIRI NIR1.6 channel as the green component (right). The images are from 23 May 2016 at 09:19 and 09:25 UTC
In the following examples the AVHRR Day Microphysics RGB will be compared with the standard SEVIRI Day Microphysics RGB. They use different channels for their green components. The solar component of IR3.9 data is used in the standard SEVIRI Day Microphysics RGB as it is more sensitive to cloud top effective particle size than the NIR1.6 channel. However, for AVHRR only the NIR1.61 channel is available during the day.
| MetOp/AVHRR Day Microphysics RGB | |||||
|---|---|---|---|---|---|
| Color | Channel | Range | Gamma | ||
| Red | NIR0.87 | 0 | 100 | % | 1 |
| Green | NIR1.61 | 0 | 70 | % | 1 |
| Blue | IR10.8 | 203 | 323 | K | 1 |
| SEVIRI Day Microphysics RGB | |||||
|---|---|---|---|---|---|
| Color | Channel | Range | Gamma | ||
| Red | NIR0.8 | 0 | 100 | % | 1 |
| Green | IR3.9 refl | 0 | 60 | % | 2.5 |
| Blue | IR10.8 | 203 | 323 | K | 1 |
Table 2: Recipes of the MetOp/AVHRR Day Microphysics RGB and SEVIRI Day Microphysics RGB schemes. The differences are highlighted in yellow.
Table 2 shows the recipes of METOP AVHRR Day Microphysics and SEVIRI Day Microphysics RGBs. The differences are highlighted in yellow. The range and gamma parameter are different for the green component because the channel is different. (Gamma is the parameter of gamma correction, which performs non-linear stretching in case gamma is not equal to 1.)
Fig. 14 shows the simulated albedo of water and ice clouds (red and blue curves) at 1.6 (top) and 3.9 (bottom) micrometers as a function of effective particle size. (The upper panel is identical to Fig. 2.) The ellipses represent the typical range of water droplet and ice particle sizes. There are similarities and differences between the 1.6 and 3.9 μm curves, but it is clear that different ranges are needed for the proper enhancement of data from these wavelengths.
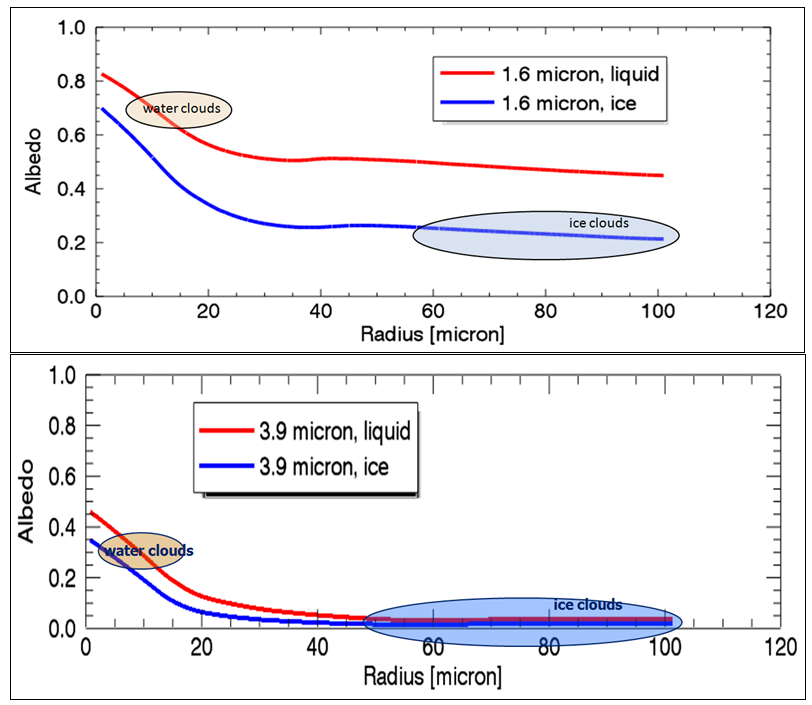
Figure 14: Simulated albedo of water and ice clouds (red and blue curves) at 1.6 (top) and 3.9 (bottom) micrometer wavelengths as a function of effective particle size. The ellipses represent the typical range of water droplet and ice particle sizes.
(Courtesy of Ralf Bennartz, University of Wisconsin)
Figs. 15 - 19 show 2-panel images of AVHRR Day Microphysics RGB and the most closely matching SEVIRI Day Microphysics RGB images. Some remarks on the comparison:
- The spatial resolution is better for AVHRR images.
- The colors of the clouds are similar.
- Surfaces unobstructed by snow or cloud are usually darker in AVHRR images because the AVHRR recipe does not use gamma correction for its green component.
- The contrast between clouds and cloud-free sea/land is higher in AVHRR images.
- The difference between water clouds with small and large droplets is much smaller in AVHRR images (see Figs. 15-17). On the other hand, the valley fog/stratus in the Alps is seen more clearly in Fig 16, since it has a higher color contrast against magenta in AVHRR images.)
- Distinguishing between ice clouds with small and large crystals is comparable or even better in the METOP AVHRR Day Microphysics RGB (see Figs. 16a, 18 and 19). Note that in Fig. 16a the cirrus clouds consist of very small ice crystals. These cirrus clouds were highly polluted by Saharan dust particles.
- Thin semi-transparent ice clouds may appear to have different thicknesses in SEVIRI and AVHRR images due to differences in scanning geometry; see for example the cirrus above the Baltic Sea in Fig. 16a. For more on this see the chapter 'Effects of the scanning geometry'.
- The shades of the AVHRR RGB's colors may change towards the edge of the swath. For more on this see the chapter 'Effects of the scanning geometry'.
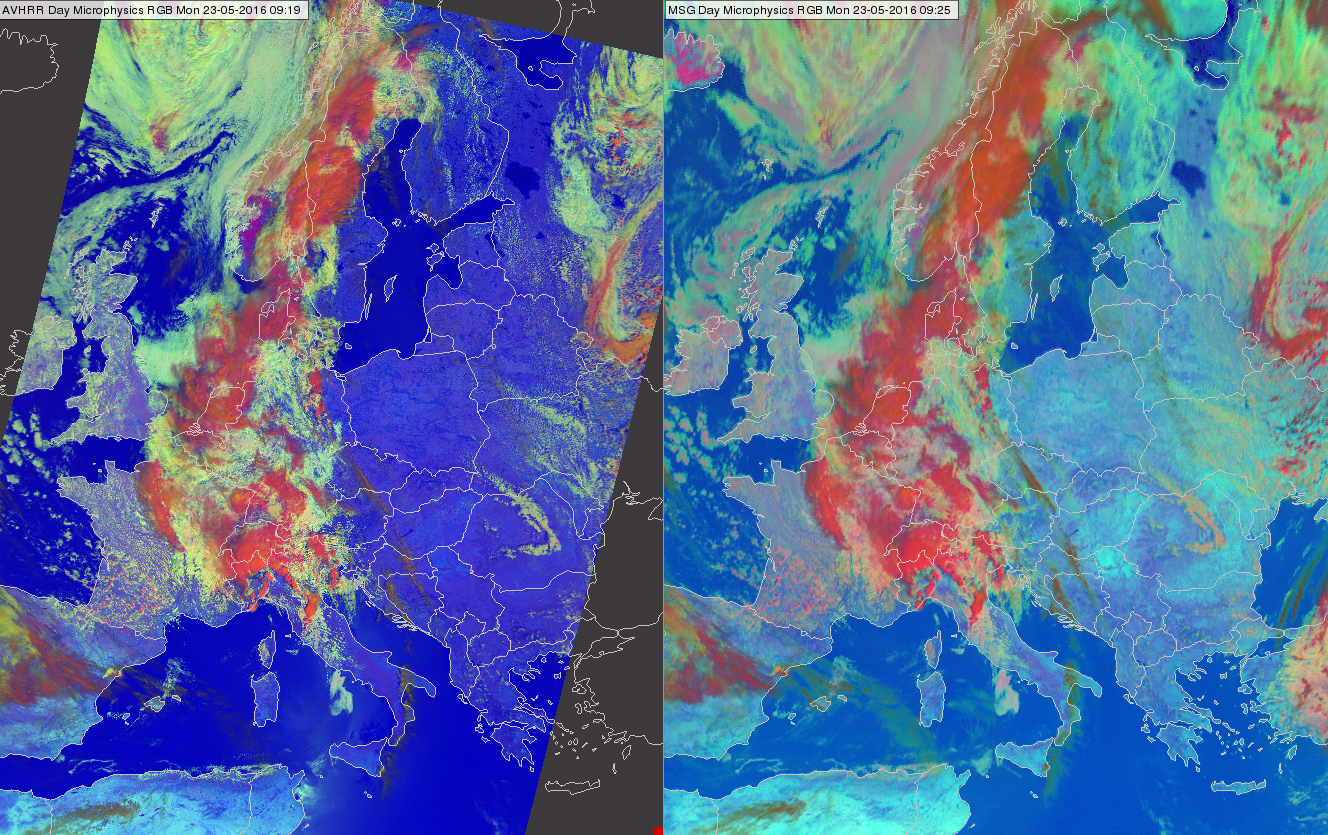
Figure 15: METOP-B AVHRR Day Microphysics RGB (left) and Meteosat SEVIRI Day Microphysics RGB (right) images on 23 May 2016 at 09:19 and 09:25 UTC
(Same slot as shown in Fig. 13)

Figure 16a: METOP-A AVHRR Day Microphysics RGB (left) and Meteosat SEVIRI Day Microphysics RGB (right) images on 9 April 2016 at 08:37 and 08:40 UTC
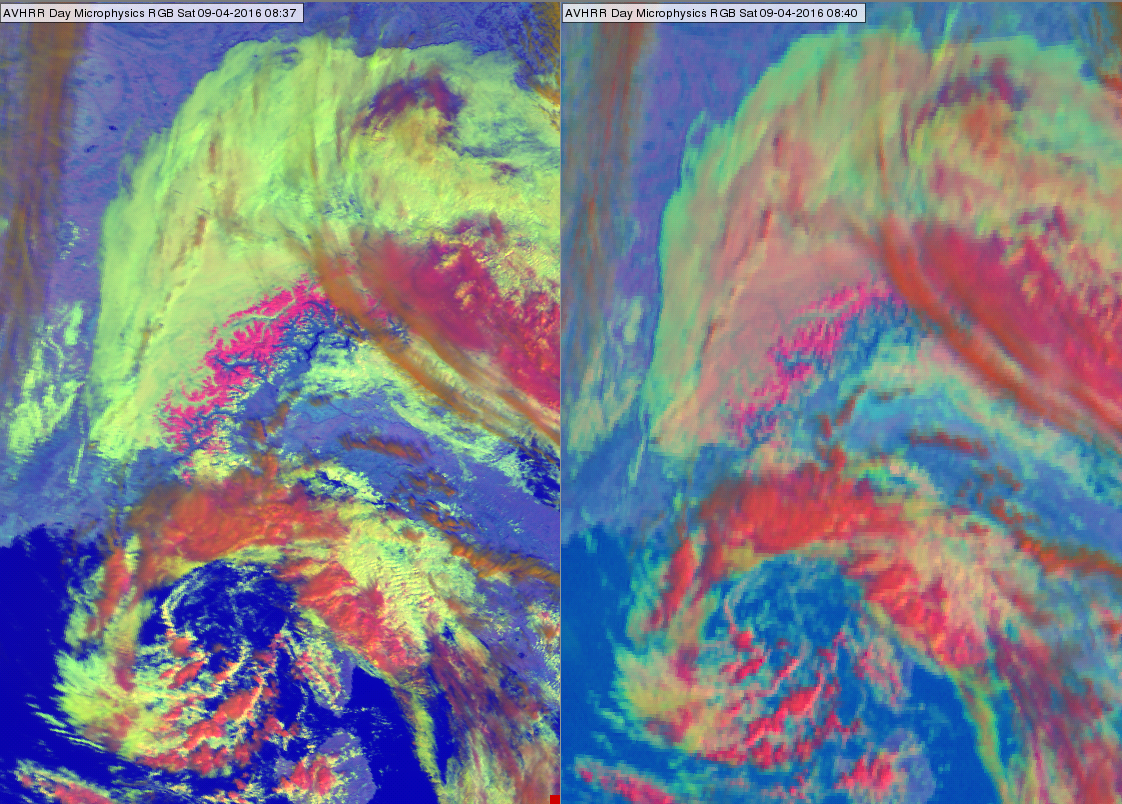
Figure 16b: METOP-A AVHRR Day Microphysics RGB (left) and Meteosat SEVIRI Day Microphysics RGB (right) images of the Alps region on 9 April 2016 at 08:37 and 08:40 UTC. A closer view.
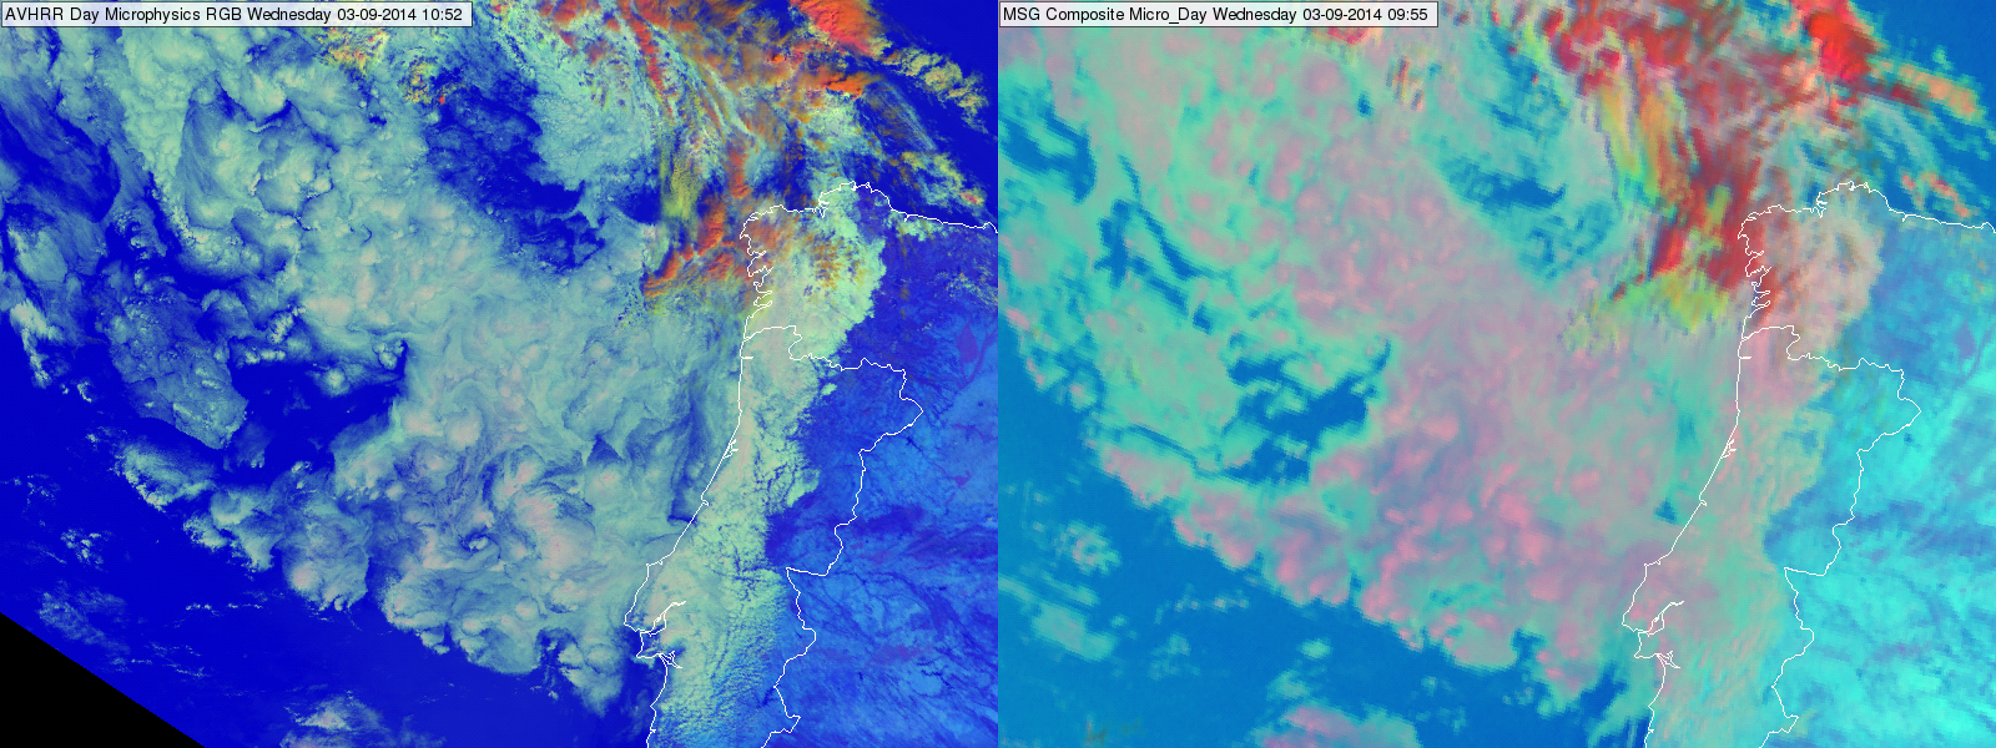
Figure 17: AVHRR Day Microphysics RGB (left) and SEVIRI Day Microphysics RGB (right) images on 3 September 2014 at 10:52 and 09:55 UTC
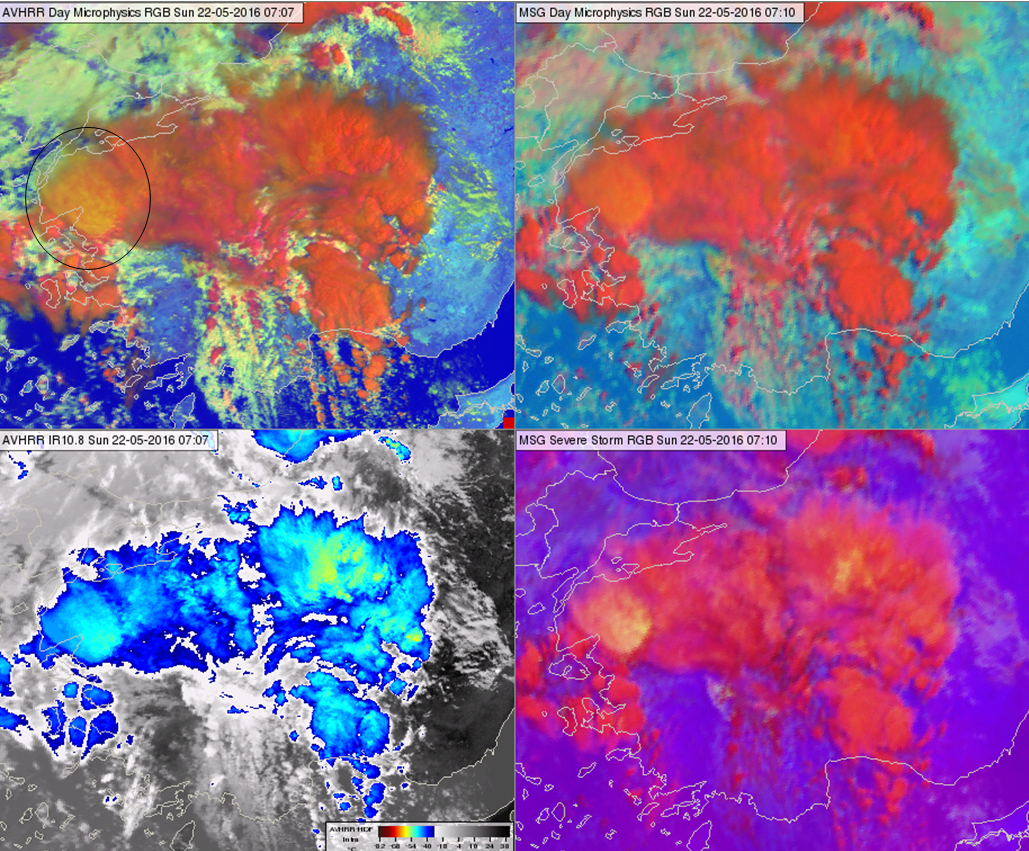
Figure 18: AVHRR Day Microphysics RGB (upper left), SEVIRI Day Microphysics RGB (upper right), AVHRR IR10.8 color enhanced (bottom left) and SEVIRI Severe Storm RGB (bottom right) images over Turkey on 22 May 2016 at 07:07 and 07:10 UTC
Fig. 18 shows convective clouds. Some storms have small ice crystals on their tops. The yellow color in the SEVIRI Severe Storm RGB image (bottom right panel) indicates small particle size and/or a very cold cloud top. However, according to the IR10.8 image (bottom left panel) it is no colder than the other cloud tops in the system, so in this case the yellow color denotes the presence of small ice crystals. In the AVHRR Day Microphysics RGB and SEVIRI Day Microphysics RGB (upper panels) this cloud top has a more orange tone. The color contrast between ice clouds with small and large ice crystals is comparable for both RGB types.
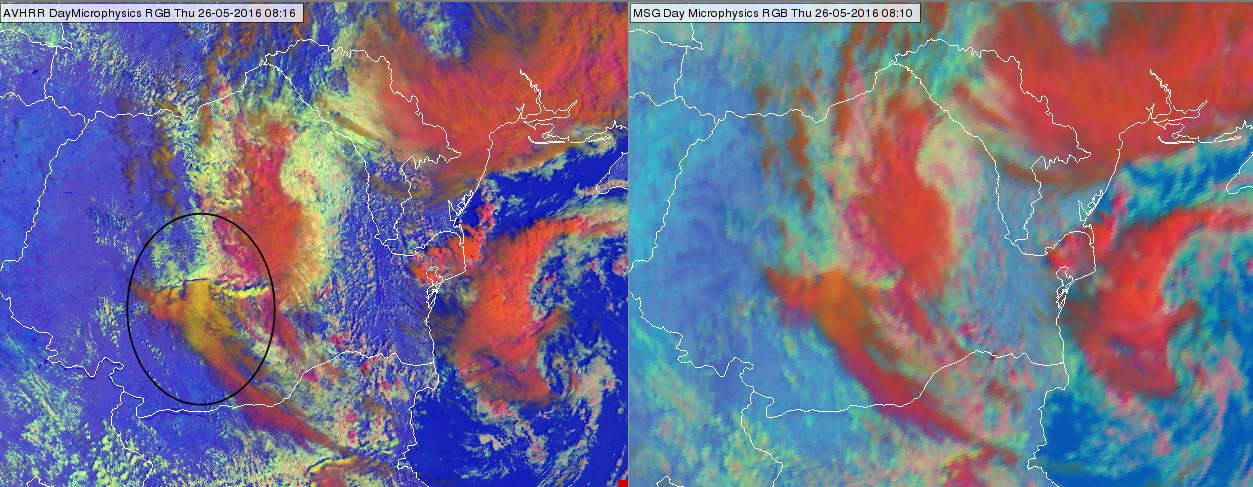
Figure 19: METOP-B AVHRR Day Microphysics RGB (left) and MSG SEVIRI Day Microphysics RGB (right) images on 26 May 2016 at 08:16 and 08:10 UTC
Fig. 19 shows high-level lee clouds south of the Carpathian Mountains. High-level lee clouds typically consist of very small ice crystals. The color contrast between ice clouds with small and large particles is higher in AVHRR Day Microphysics RGBs than in SEVIRI Day Microphysics RGBs.