How to create METOP AVHRR Day Microphysics RGB images
EUMETSAT's recommendation for Microphysics RGBs is that cloud thickness information should be visualized in red, microphysical information in green, and temperature information in blue.
The 'recipe' of the Day Microphysics RGB is summarized in Table 1. The table shows which channels are visualized in which colors. The measured values should be calibrated to brightness temperature or reflectivity. (The reflectivity values should be normalized by the cosine of the solar zenith angle.) The images are then enhanced - linearly stretched - within the ranges listed in the table.
| AVHRR Day Microphysics RGB | ||||
|---|---|---|---|---|
| Color | Channel | Range | ||
| Red | NIR0.87 | 0 | 100 | % |
| Green | NIR1.61 | 0 | 70 | % |
| Blue | IR10.8 | 203 | 323 | K |
Table 1: Recipe of the AVHRR Day Microphysics RGB scheme
The following examples (Figs. 4-6) show how the Day Microphysics RGB is made by combining the NIR0.87, NIR1.61 and IR10.8 images. It shows both the resulting RGB as well as the components, which are enhanced according to Table 1. The IR10.8 image is bright for high and dark for low brightness temperatures.

Figure 4a: METOP-A AVHRR NIR0.87 (upper left), NIR1.61 (upper right), Day Microphysics RGB (bottom left) and IR10.8 (bottom right) images of the coast of France and the UK on 10 April 2016 at 09:55 UTC
Fig. 4a shows the color components of a Day Microphysics RGB image: the channels which are in the recipe with the corresponding enhancement. The lower left panel shows the Day Microphysics RGB.
Fig. 4b is the same as Fig. 4a except that the three components are visualized with colors instead of grayscale, which is how the three components are used together in the RGB.
Fig. 4c shows the four panels of Fig. 4a on top of each other. Hover your mouse over the image to use the slider.
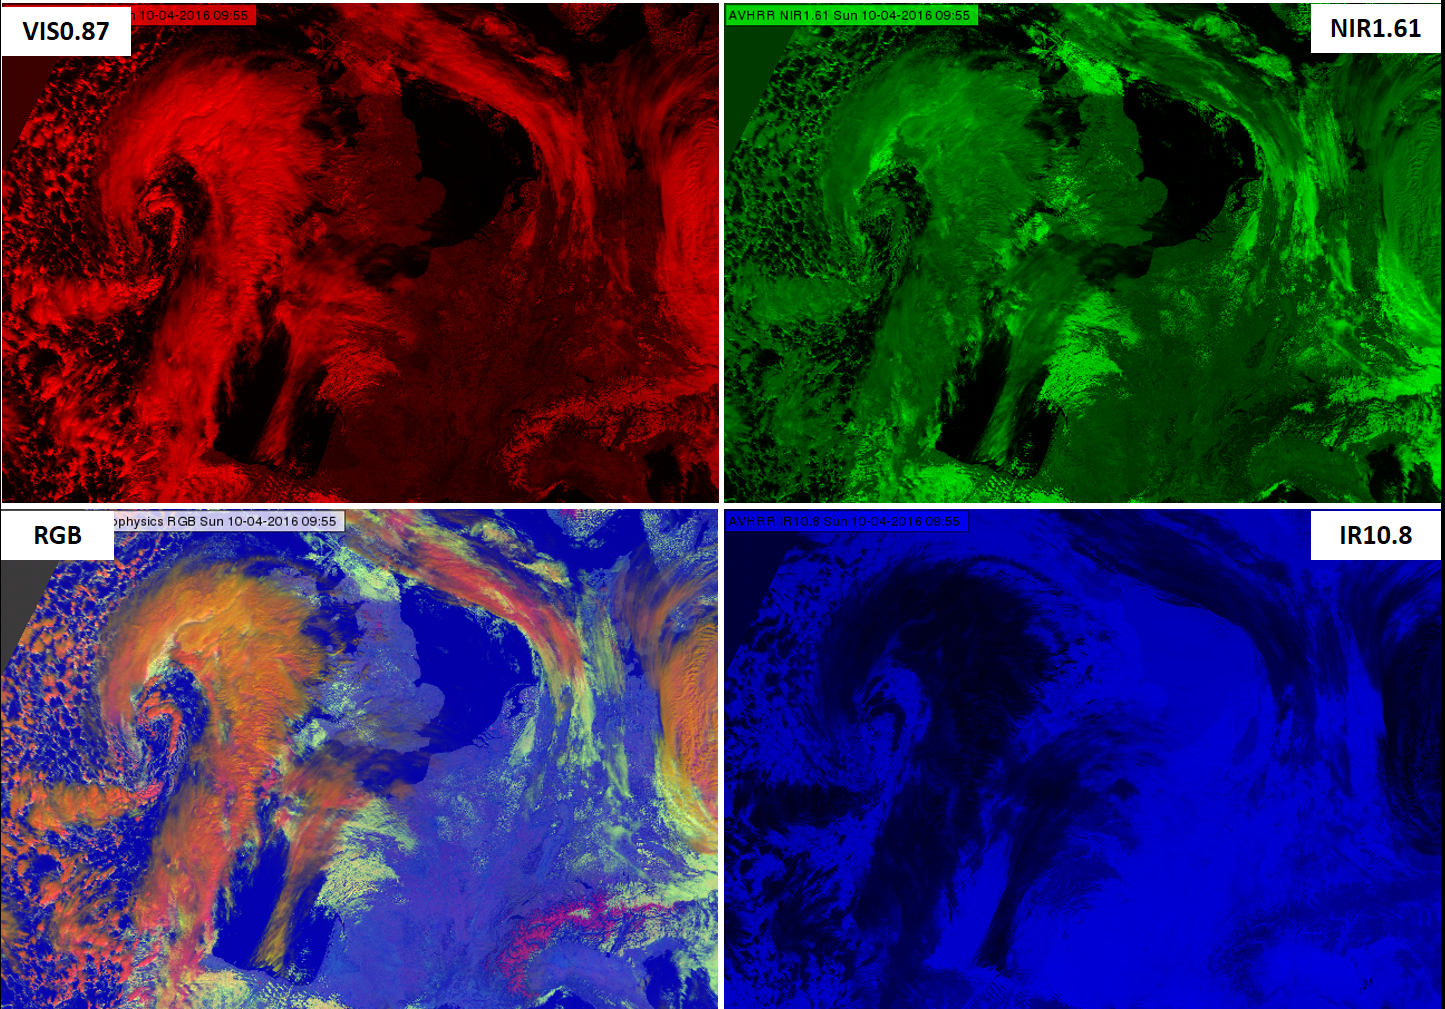
Figure 4b: METOP-A AVHRR NIR0.87 (upper left), NIR1.61 (upper right), Day Microphysics RGB (bottom left) and IR10.8 (bottom right) images of the coast of France and the UK on 10 April 2016 at 09:55 UTC
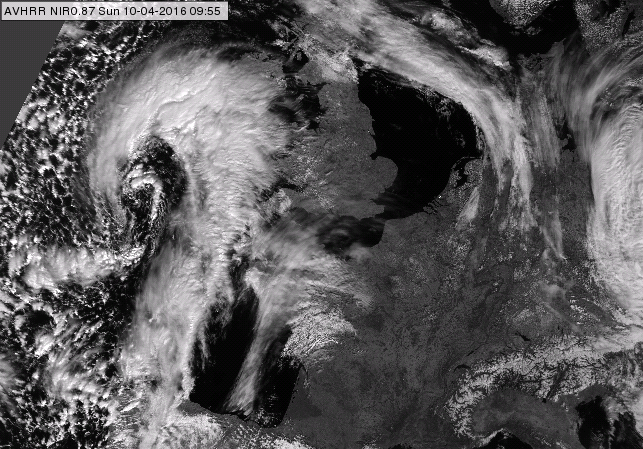
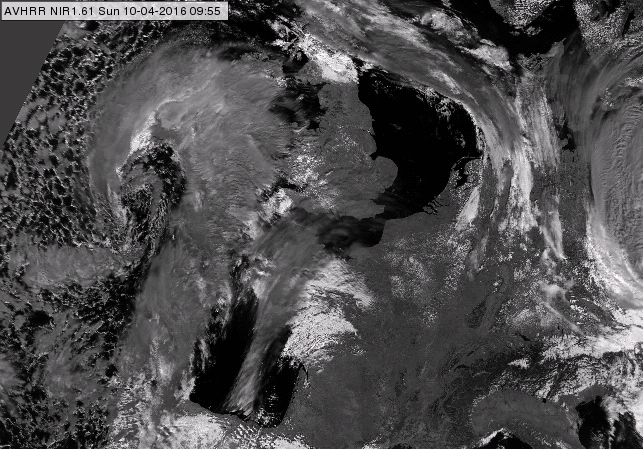
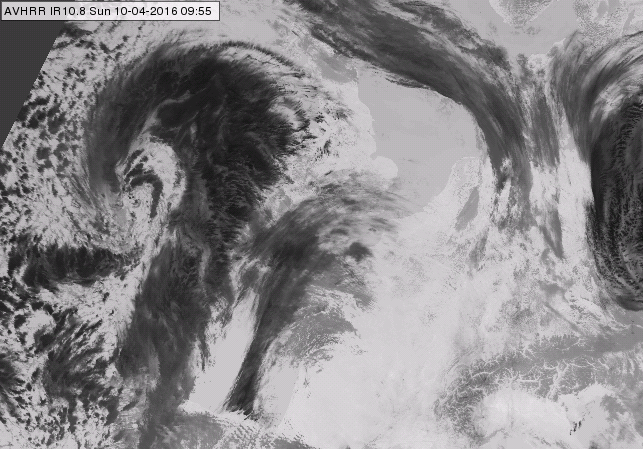
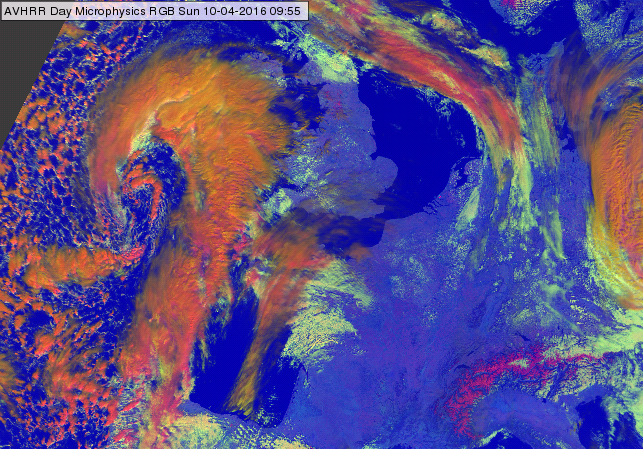
Figure 4c: 4-Panel display, please use your mouse to compare the four images. METOP-A AVHRR NIR0.87, NIR1.61, Day Microphysics RGB and IR10.8 images of the coast of France and the UK on 10 April 2016 at 09:55 UTC
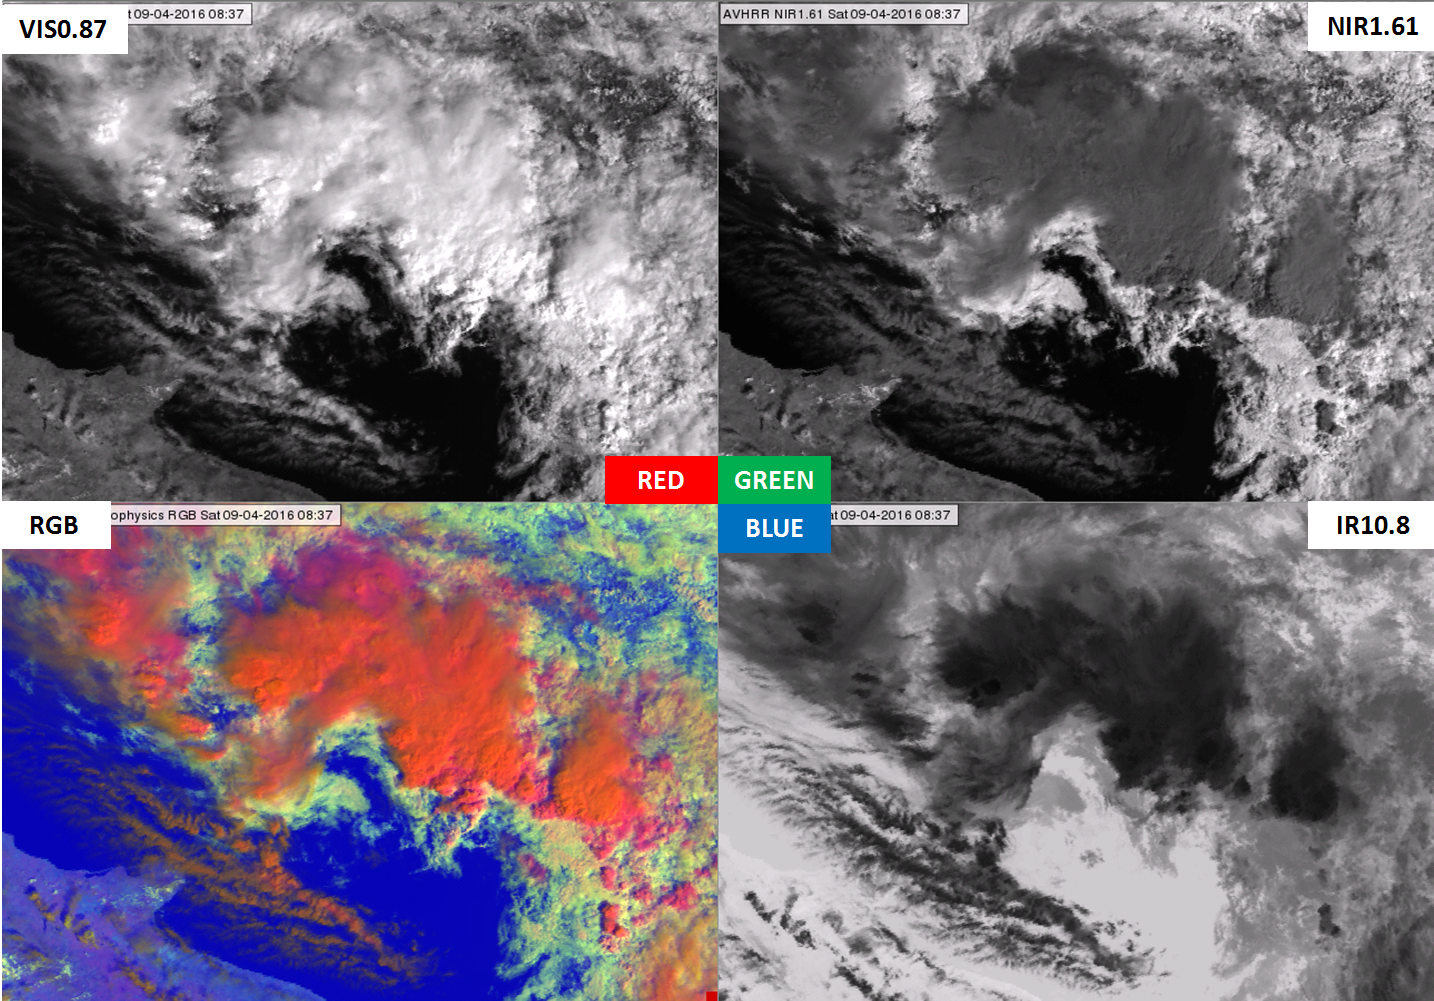
Figure 5a: METOP-A AVHRR NIR0.87 (upper left), NIR1.61 (upper right), Day Microphysics RGB (bottom left) and IR10.8 (bottom right) images of the Adriatic Sea region on 9 April 2016 at 08:37 UTC
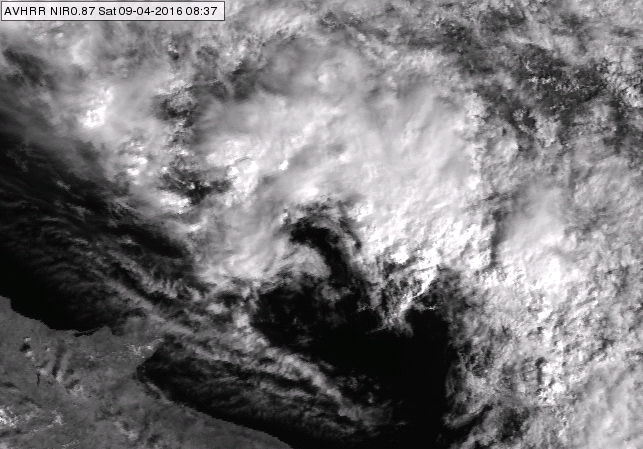
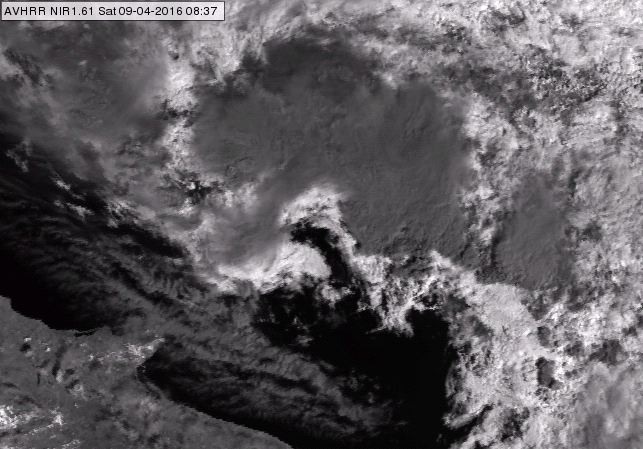
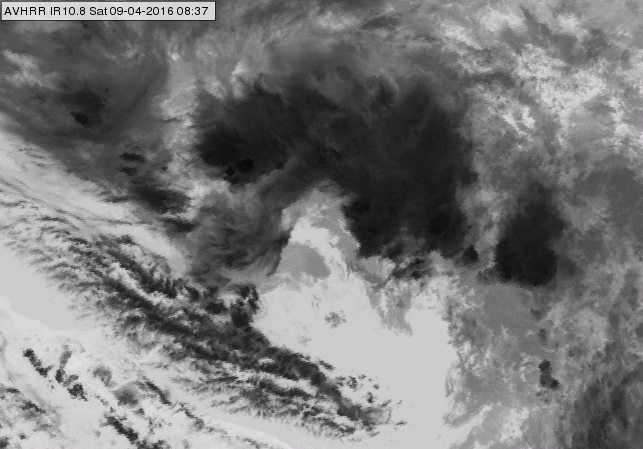
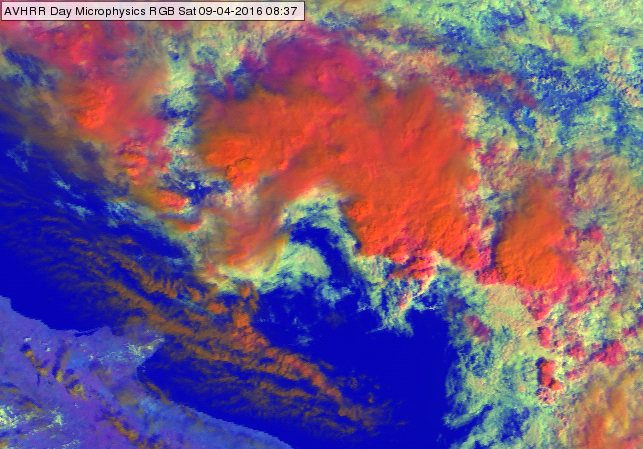
Figure 5b: 4-Panel display, please use your mouse to compare the four images. METOP-A AVHRR NIR0.87, NIR1.61, Day Microphysics RGB and IR10.8 images of the Adriatic Sea region on 9 April 2016 at 08:37 UTC
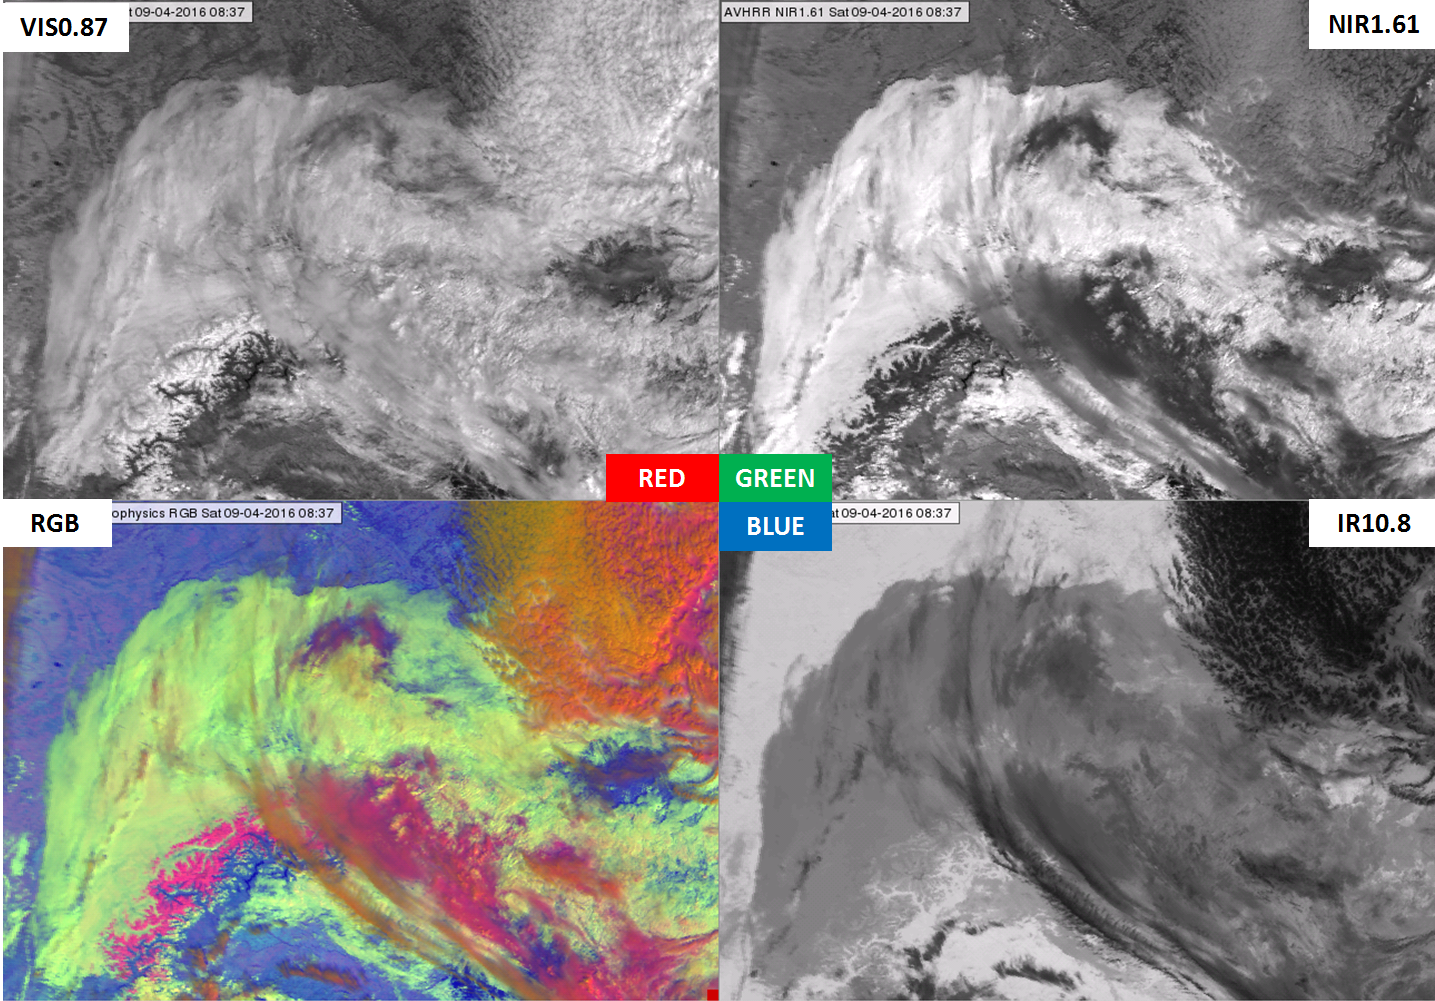
Figure 6: METOP-A AVHRR NIR0.87 (upper left), NIR1.61 (upper right), Day Microphysics RGB (bottom left) and IR10.8 (bottom right) images of the Alps region on 9 April 2016 at 08:37 UTC