Typical colors
Fig. 3 shows the typical colors of Night Microphysics RGB images. These are just examples; actual images have much greater variation in their colors and tones. Note that the shade of the colors may vary across the swath. For more on this see the chapter 'Effects of the scanning geometry'.
- The colors of the clouds depend on cloud top temperature, cloud top phase and cloud optical thickness (transparency).
- The colors of the cloud-free surface depend on surface temperature and the (low-level) moisture content of the atmosphere.
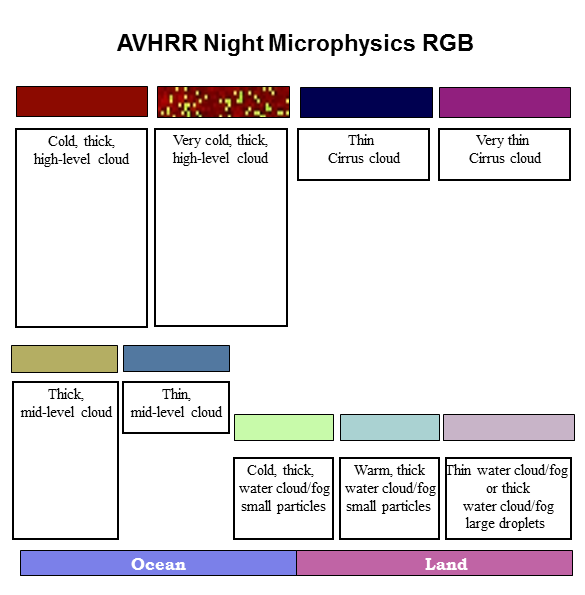
Figure 3: Typical colors of the Night Microphysics RGB
The typical colors of clouds are as follows:
- Thick low-level water clouds (fogs) are light green. Warmer water clouds are depicted in bluer tones. If the water cloud consists of large droplets it is gray with a pinkish tone.
- Thin low-level water clouds (fogs) are gray with a pinkish tone.
- Thick mid-level clouds appear (greenish) tan.
- Thin mid-level clouds appear greenish or bluish gray. The color of the very thin mid-level clouds approximates the color of the underlying surface.
- Thick ice clouds are red-brown. However, green dots often appear on the top of a thick and very cold ice cloud (see the high clouds in Fig. 5a). These 'noisy pixels' have colors similar to thick water clouds, but it is important to remember that a cold, thick cloud top with green dots means it is very cold, not that there are warm water clouds in some pixels! (The explanation for this feature is that for very cold, thick clouds the measured radiation is almost zero in the IR3.74 channel, and the retrieved brightness temperature is noisy.)
- Medium thin semi-transparent ice clouds are dark blue.
- The color of very thin cirrus clouds approximates the color of the underlying surface (e.g. dark pink over land). Note that their color depends on their height as well. VERY high and VERY thin clouds can also be black.
- Dust clouds appear pink.
The typical colors of cloud-free surfaces are as follows:
The typical colors of cloud-free surfaces depend on surface temperature and the moisture (particularly on low-level moisture) content of the atmosphere.
The color is usually determined by temperature. At night, the sea is usually warmer than the land, so
- the sea usually appears bluish, while
- (non-deserted) land usually appears pinkish.
However, the color of a cloud-free surface depends not only on the surface temperature, but on atmospheric (low-level) moisture content as well:
- moist areas appear more bluish, while
- dry areas appear more pinkish.
In cloud-free regions both the (IR12-IR10.8) and the (IR10.8-IR3.74) differences depend on atmospheric moisture content. A cloud-free atmosphere is more transparent around 3.74 μm than around 10.8 μm, and more transparent around 10.8 μm than around 12.0 μm, as shown in Fig. 4. If the moisture content is higher, the red and the green components of the surface will be lower, so the mixed color will appear more bluish.
![]()
Figure 4: Atmospheric transmission spectra
(Source: http://www.photonics.com/EDU/Handbook.aspx?AID=25132)
Fig. 5 shows an example where the effects of moisture content are clear in the Night Microphysics RGB image. The structure of bluish and pinkish tones over the Mediterranean, the North Sea and the Baltic Sea reflect the effects of atmospheric moisture. For example, the sharp boundary between the pinkish and bluish cloud-free areas over the North Sea is a moisture boundary.
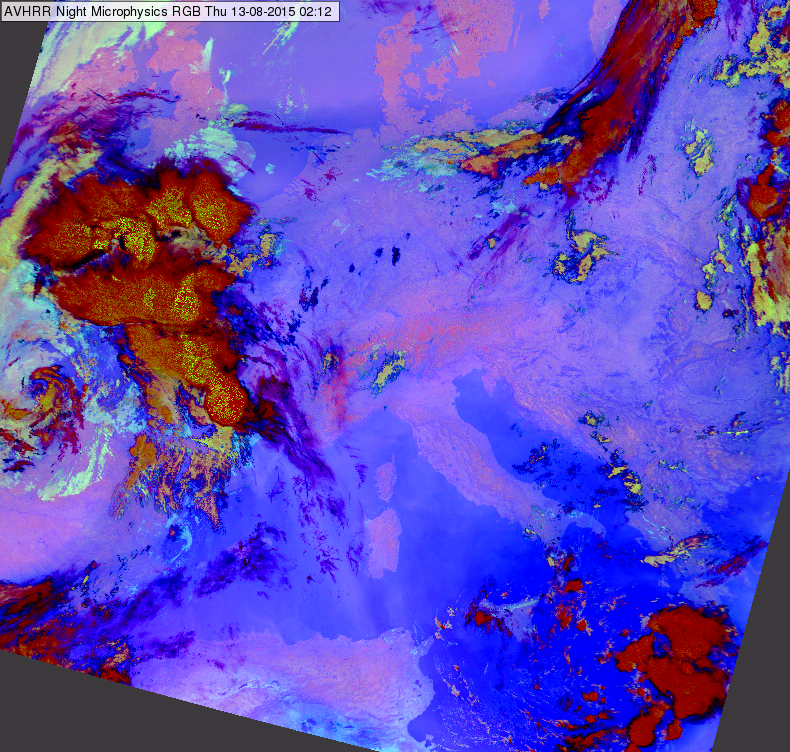
Figure 5a: AVHRR Night Microphysics RGB for 13 August 2015 at 02:12 UTC
Fig. 5b shows a METEOSAT SEVIRI Night Microphysics RGB image overlaid by ECMWF TPW (Total Precipitable Water in mm) analyses for the same day at 00 UTC. The ECMWF's TPW analysis fits the pinkish-bluish color scheme of the Night Microphysics RGB well. It confirms the moisture boundary across the UK and Denmark and the presence of an area of increased moisture southeast of Italy.
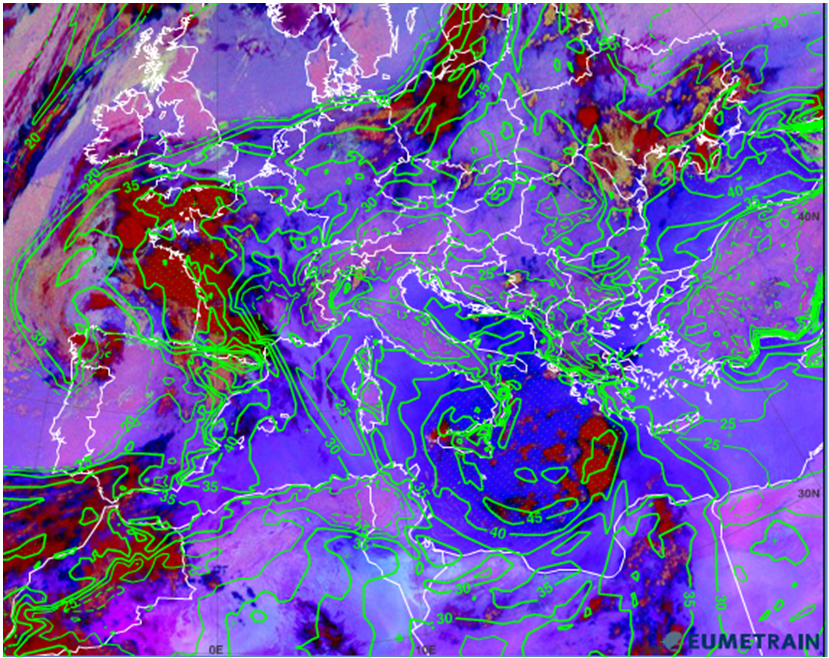
Figure 5b: SEVIRI Night Microphysics RGB image overlaid by ECMWF Total Precipitable Water analysis on 13 August 2015 at 00 UTC
(Source: e-port, EUMeTrain)
The Night Microphysics RGB contains information on the effective particle size of water clouds, because the IR3.74 emissivity is somewhat higher if the cloud top droplets are large. In that case the otherwise large green component becomes slightly weaker. An example is presented in the left panel of Fig. 6. For comparison, the right panel shows a SEVIRI Day Microphysics RGB from some hours earlier. The pinkish gray stripes in the greenish maritime water clouds (seen in left panel) consist of larger droplets. The similar structure of the same cloud in the SEVIRI Day Microphysics RGB confirms this.
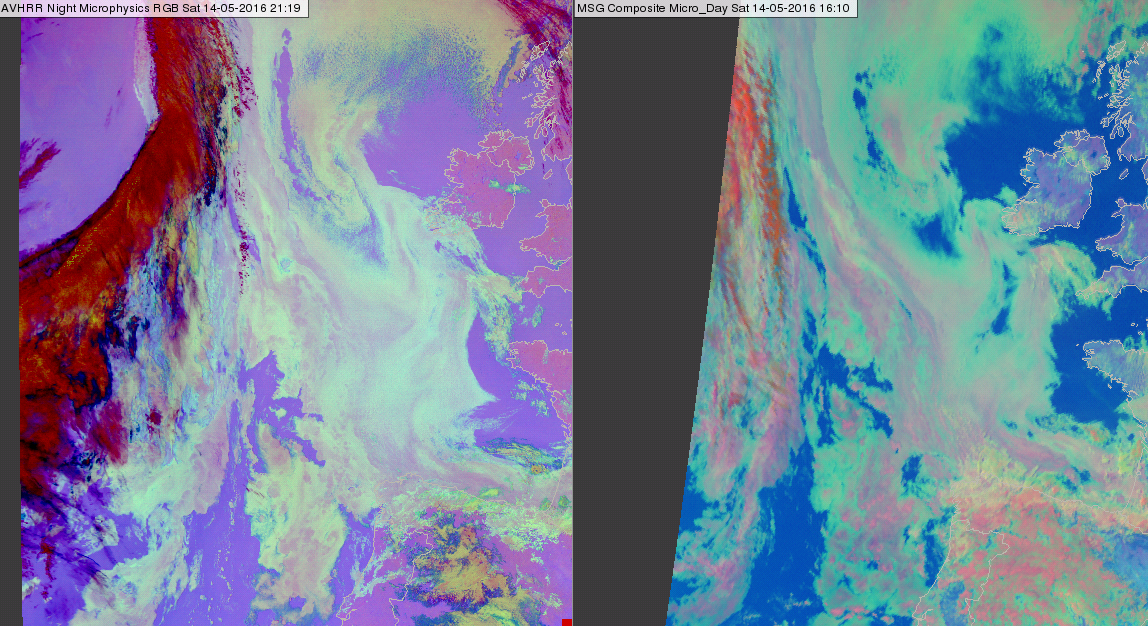
Figure 6: AVHRR Night Microphysics RGB image (left) and SEVIRI Day Microphysics RGB image (right) on 14 May 2016 at 21:19 and 16:10 UTC
Ship tracks are another example. Ships inject a large amount of condensation nucleus into the atmosphere, so along their trails the water cloud consists of smaller droplets. The upper panel of Fig. 7 shows greenish ship tracks. For comparison, the bottom panel shows a SEVIRI Day Micro RGB some hours later.
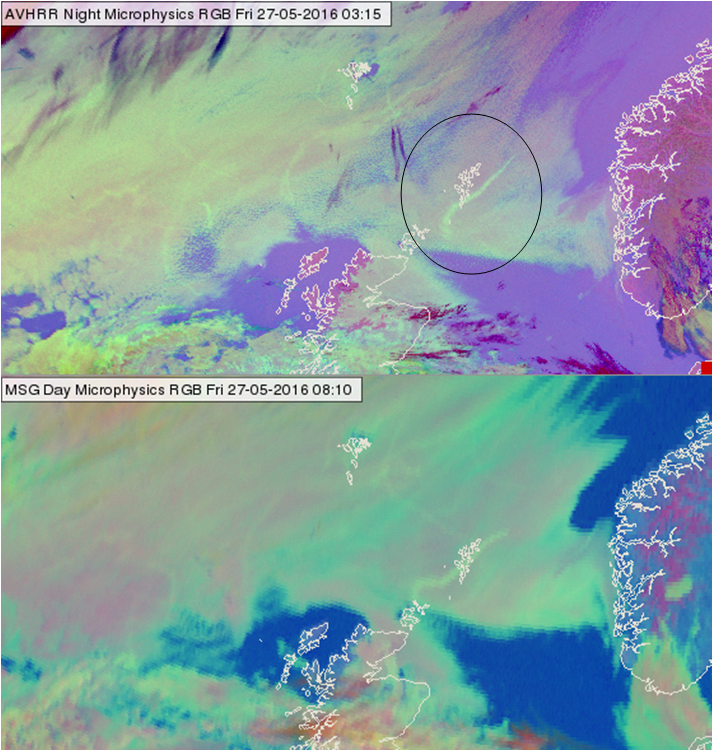
Figure 7: AVHRR Night Microphysics RGB image (top) and SEVIRI Day Microphysics RGB image (bottom) for 27 May 2016 at 03:15 and 08:10 UTC
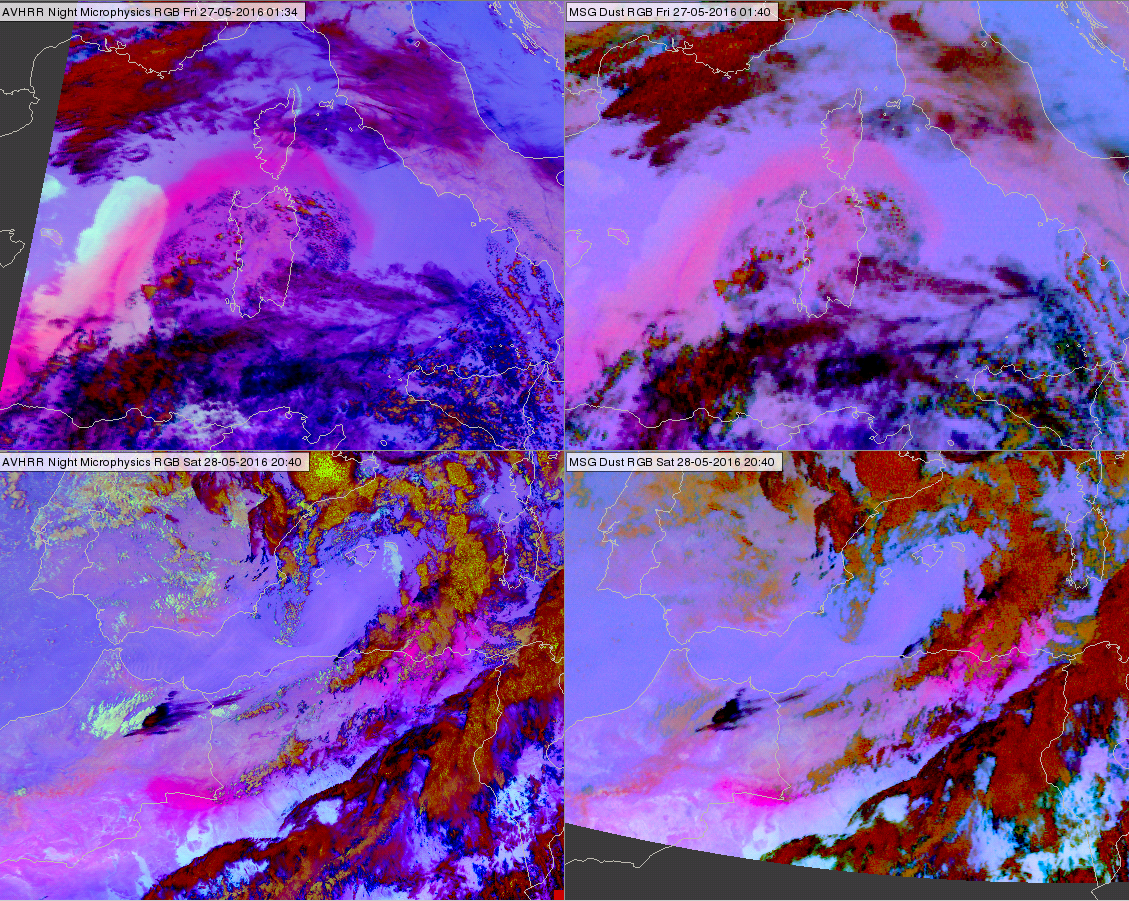
Figure 8: AVHRR Night Microphysics RGB images (left panels) and SEVIRI Dust RGB images (right panels) on 27 May 2016 at 01:34 and 01:40 UTC (upper panels) and 28 May 2016 at 20:40 UTC (bottom panels)
Fig. 8 presents AVHRR Night Microphysics RGB images together with the temporally most closely matching SEVIRI Dust RGB images available. In the Dust RGB the pink color indicates thin dust clouds. The thin dust clouds are also seen in the AVHRR Night Microphysics RGB, and are also shown in pink. This is because the (IR12-IR10.8) brightness temperature difference (BTD) values are high for thin dust clouds. This BTD is the key channel combination for dust detection, and it comprises the red component in both RGBs.
Note that all colors discussed above refer to nighttime. If some part of the image is already/still sunlit the cloud appears magenta, such as in the top left part of Fig. 9.
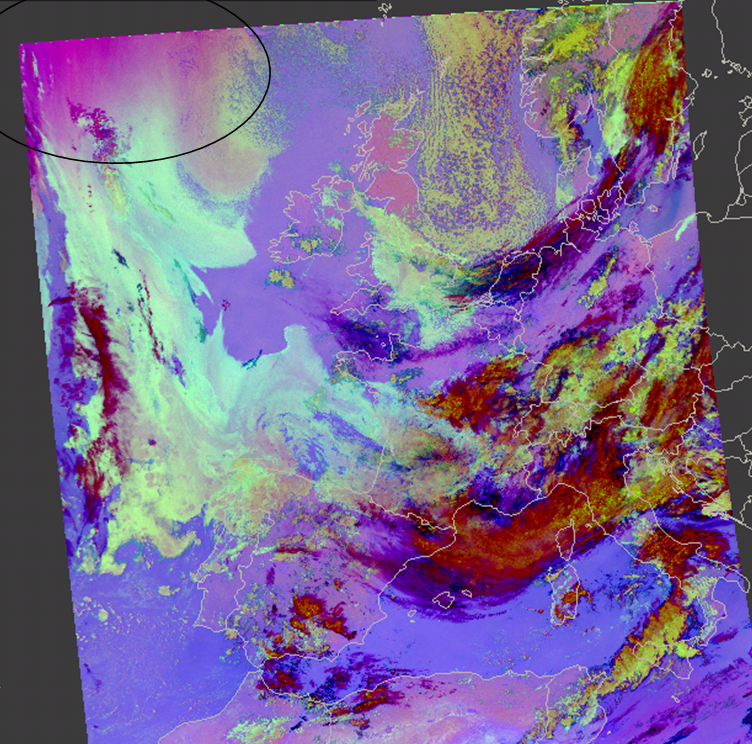
Figure 9: AVHRR Night Microphysics RGB image on 13 May 2016 at 20:52 UTC