Directional effect
For homogeneous surfaces, radiometric temperature is equivalent to the isotropic thermodynamic temperature. However, land surfaces are far from homogeneous, as seen in the example shown in Figure 16, where one MSG pixel with 3x3 km size is represented by a white line polygon: several different materials can be identified at the surface within this area, such as water, sand, concrete, trees and rocks, characterized by distinct spectral emissivities.
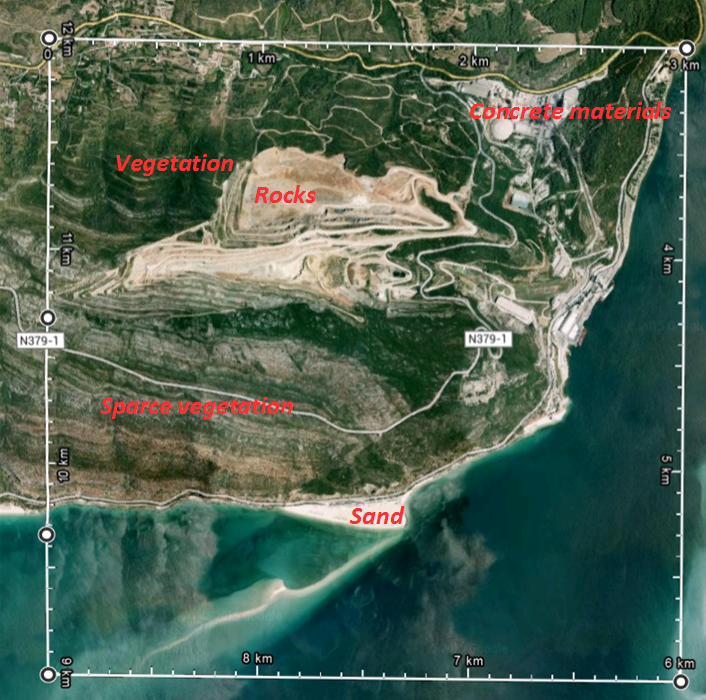
Fig. 16: Illustration of what can be found within an MSG pixel at its best spatial resolution (3 x 3 km). The MSG pixel is represented by the white line polygon. Distinct materials characterized by distinct emissivities can be identified.
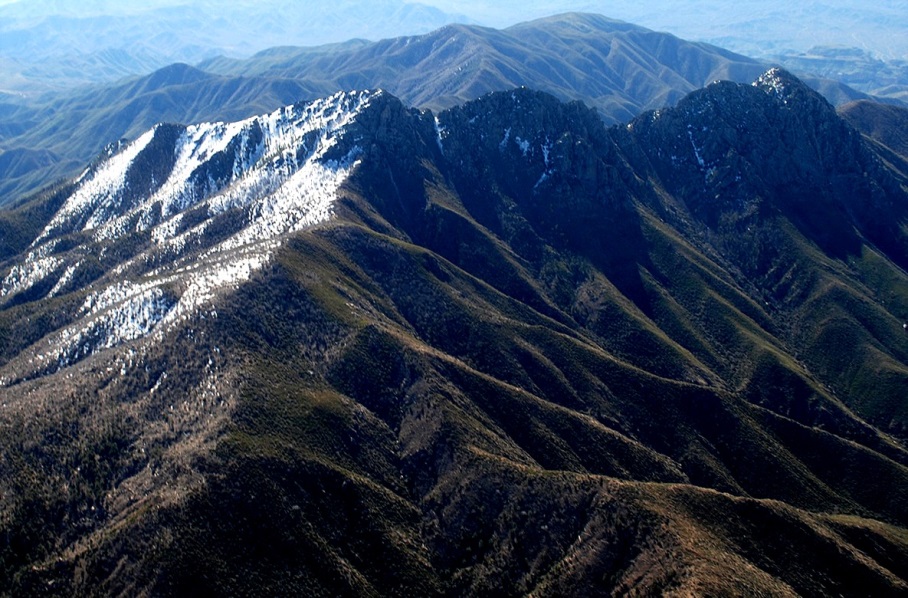
Satellite observations are taken from varying perspectives: neither viewing geometry nor the surface solar illumination are fixed. This means, for example, that with landscapes with moderate tree cover pixels the sensor will "see" different fractions of the canopy and the "background" surface (bare soil or low vegetation) and parts of the "background" surface components will be in shadow (Rasmussen et al, 2011), as illustrated by the picture in Figure 17.
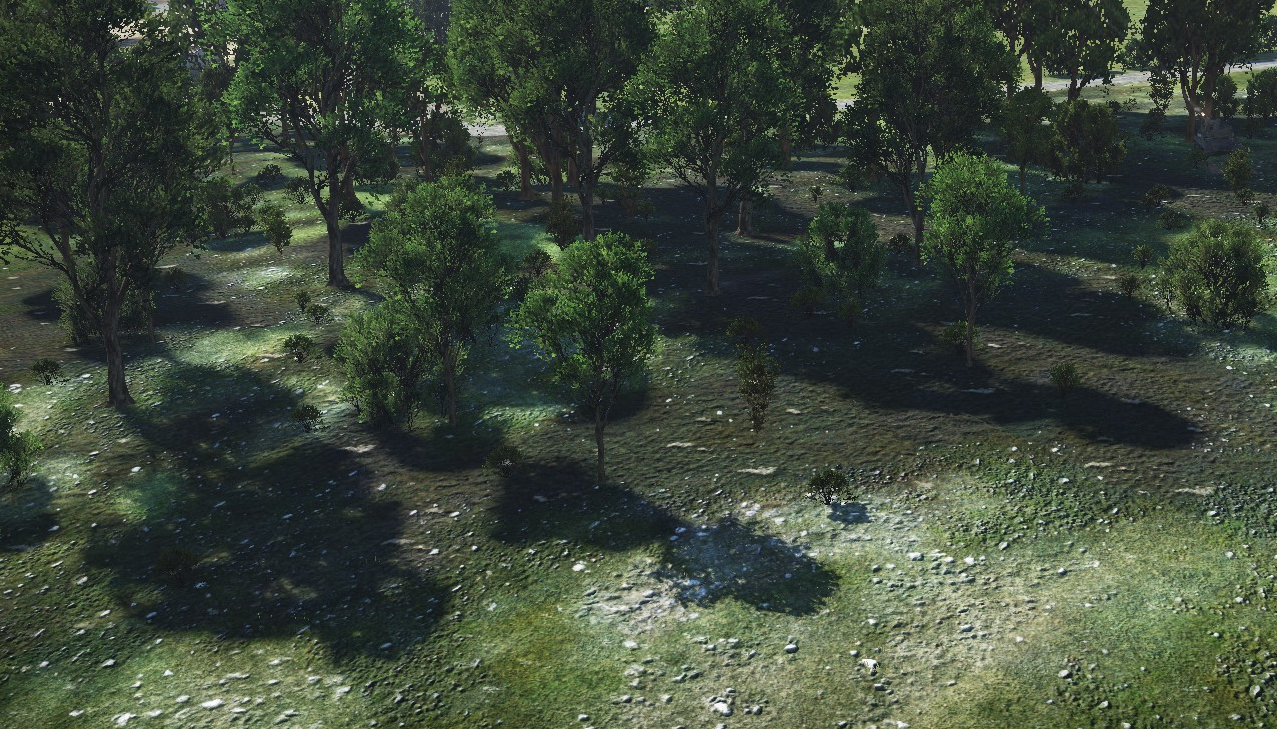
Fig. 17.: The picture of a region with moderate tree cover shows how a scene observed by a satellite may be composed of illuminated canopy, shadowy canopy, illuminated ground and shadowy ground components.
In short, there are several factors that contribute to the uncertainty of LST estimations. Land surface emissivity is heterogenous and anisotropic. Different kinds of trees lead to varying fractions of sunlight and shadows within a pixel both on the ground and in the canopy. The satellite viewing angle as well as the sun's elevation have an effect on the measurements. LST retrievals obtained for the same scene, using the same sensor, but at different viewing angles would likely produce different temperature values, depending on factors like surface type and slope orientation relative to the sun. These directional effects are to be taken into account particularly when comparing LST products from distinct satellites located in different positions with respect to the surface.
The work by Sofia L. Ermida et al. (2014) has shown that the viewing/illumination effect varies throughout the year and throughout the day as it depends on the relative temperatures of the shaded and sunlit ground and tree components within the viewed model scene. Figure 18 shows an example of the effect of viewing/illumination angles during a day. This figure shows that the fraction of shaded ground at noon is higher for the south (SEVIRI) view than for the nadir view, i.e, when the view zenith angle increases there is an increase in shaded background, which will result in a decrease in composite temperature.

Fig. 18: Illustration of illumination and shadow produced by a single tree for a summer day (15 July), as seen from nadir (top row) and from SEVIRI's zenith and azimuth angles (bottom row), corresponding to 9:00, 12:00, and 16:00 h local time.
LST measurements from 2009 over Senegal (Rasmussen et al, 2011) demonstrate the different amplitudes and seasonal evolution over sunlit and shadowy canopy and ground subpixel components as shown in Figs. 19 and 20. The two figures present the diurnal temperature variation of these components for two 7-day periods in the beginning of June and October, respectively.
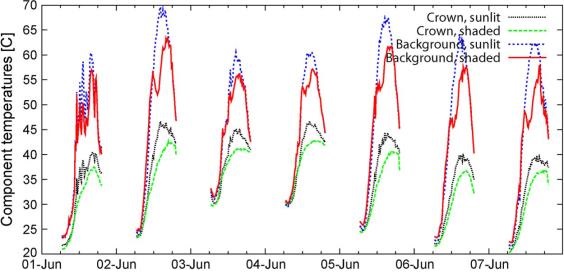
Fig. 19: Diurnal LST variation of subpixel components crown-sunlit, crown-shaded, background-sunlit, background-shaded for a 7-day period in the beginning of June 2009, in Senegal.
In June, before the start of the rainy season, the diurnal range of temperatures is large, reaching almost 50°C for the sunlit background component, followed closely by the shaded background component (Figure 19). The canopy components show a considerably lower range of approximately 25°C (green and black lines). Overall the sunlit component temperatures are larger than the corresponding shaded component temperatures (black line compared to green and blue line compared to red).
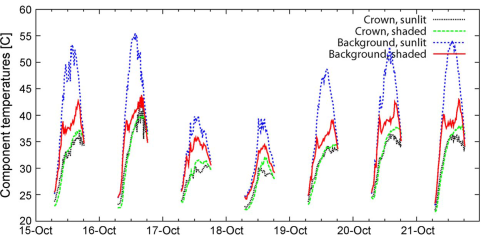
Fig. 20: Diurnal LST variation of subpixel components crown-sunlit, crown-shaded, background-sunlit, background-shaded for a 7-day period in the mid of October 2009, in Senegal.
Results from October (Figure 20) show that the diurnal range is smaller, and the shaded background temperatures are more similar to the canopy component than to the sunlit background component. In some cases, the shaded canopy component temperatures are higher than the sunlit canopy component temperatures. For the study period, it is to be expected that the sunlit and shaded canopy component temperatures are almost equal as plenty of moisture is available for the trees to transpire, effectively cooling the canopy to a uniform temperature.
So far we have seen how directional effects can be induced by the tree cover. Next we will take a look at how these effects can also be caused by topography.
Imagine two satellites as shown in Figure 22: satellite 2 looks at the surface from a nadir position while satellite 1 has a non-nadir view and, as in this example, this satellite is located on the same side of the sun. This means that the contribution of illuminated surfaces to the total radiance measured by satellite 1 will be higher than for satellite 2. This effect has been considered in several studies involving satellite data. For instance Minnis and Khaiyer (2000) examined the angular dependence of brightness temperatures using three geostationary satellites (GOES 8, GOES 9 and GOES 10), having found brightness temperature differences due to uneven terrain. Another example is Lipton and Ward's (1997) theoretical study over the mountains in Colorado, which reported that local variations in slope orientation can lead to surface temperature variations up to 30°C, as radiance emitted from the sunlit side of a mountain is warmer than radiance emitted from the shadowed side.

Fig. 22: Schematic representation of directional effects induced by topography. The total contribution of radiance from the sunlit slopes to satellite 1 is higher than for satellite 2 and thus LST measured by satellite 1 will be overestimated while compared to satellite 2.
A study considering LST measurements from the MODIS and SEVIRI satellite sensors over the Iberian Peninsula has demonstrated this effect: difference maps of LST (SEVIRI-MODIS) for MODIS nighttime passage over Iberia at a given day in September 2005 show values within the -3 to +3°C range (Figure 23, right). Regional differences vary considerably more during the day than at night, and the variability is especially high in the mountainous central Iberia (Figure 23, left). Why are the differences LST (SEVIRI-MODIS) greater and biased toward positive values in mountains?

Fig. 23: LST from SEVIRI minus LST from MODIS for 14 September 2005 corresponding to MODIS's diurnal passage (left) and nighttime passage (right)
For MODIS's morning passage over the Iberian Peninsula (~11UTC), positive satellite view angles mean the satellite is looking at the surface from the west, whereas negative viewing angles indicate views from the east (Figure 24). In the morning, the contribution to MODIS (looking at the surface from the west) comes mostly from shadowed regions, as opposed to the MSG which faces the sunlit slopes. The difference LSTSEVIRI-MSG-LSTMODIS obtained over the peninsula for a 7-day period in September 2005 as a function of MODIS zenith angle confirms this theory; positive MODIS angles (west views) imply an underestimation of LST measured from this sensor as compared to LST from SEVIRI-MSG (Figure 25). This dependence on the observing angle is not seen for the evening passage, as confirmed by Figure 26.
| MODIS Zenith Angle < 0 | Zenith Angle > 0 | |
| @ Morning MODIS passage (orbit in descending node) | 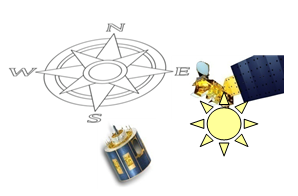 |
 |
| @ Evening MODIS passage (orbit in ascending node) | 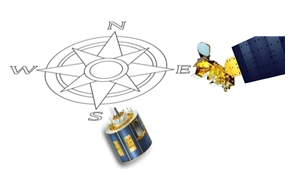 |
 |
Fig. 24: Schematic representation of MODIS and MSG's relative positions for MODIS's morning passage (upper row) for negative and positive viewing angles (east and west views) (respectively - a negative viewing angle means MODIS is viewing the grid from the east)
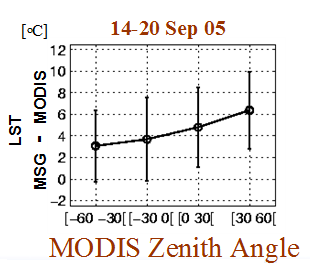
Fig. 25: LSTSEVIRI-MSG-LSTMODIS obtained over the Iberian area for a 7-day period in September 2005 as a function of MODIS zenith angle (VZA). When MODIS VZA is positive (west view) its measured temperature is underestimated while compared to SEVIRI (facing the sunlit slopes).
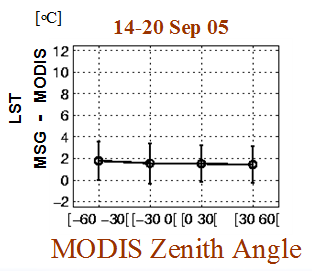
Fig. 26: LSTSEVIRI-MSG-LSTMODIS obtained over Iberia for a 7-day period in September 2005 as a function of MODIS zenith angle, for MODIS nighttime passages. No dependence with MODIS zenith angle is observed for these situations.
In short:
To estimate LST from satellite TIR measurements, assuming the cloud masking is fixed (an accurate cloud mask is mandatory for LST processing), we need to solve the RTE, for which we need information from:
- Atmospheric temperature and humidity profiles (i.e. Transmissivity)
- Surface spectral emissivity
Uncertainties in LST estimation depend on:
- Sensor noise
- Channels spectral response functions must me be known, otherwise there will be an important source of uncertainty.
Characteristics of satellite LST retrievals:
- LST corresponds to the composite of temperature and emissivity of all elements within the satellite FoV.
- In the case of bare ground, LST estimations from infrared measurements correspond to the temperature of a very thin surface (the first approximately 10-50 μm), and therefore it is appropriate to refer this as a skin temperature.
- LST has a directional effect (depends on the projected fractional cover of each endmember (In literature of remotely sensed image analysis, an endmember is defined as a pixel containing only one land cover substance. [Peter Tan et al., 2013])).
- It is difficult to decouple the LST, LSEs, and downward atmospheric radiance in measured radiances.