Physical Background
In a cold front with a strong postfrontal flow the appearance of line convection with downburst winds are common. The preconditions are well recognisable with use of satellite and NWP output. The convection is caused by triggering of potential instability. The strong downbursts develop due to a vertical exchange of impulse. The weather situation during storm Emma on March 1st is a classical example of line convection with downburst winds when an active depression moved east to southeast over the Northsea. In this part of the case study these signals from Satellite and NWP in relation to the downburst winds present during storm Emma are discussed and presented.
On the 1st of March a strong depression moved alongside the southern tip of Norway further Eastward.

Figure 1. Surface analysis 1 March 2008 – Source : ZAMG
Behind the cold front the strong gradient of isobars is already indicative for a strong flow as seen in the surface analysis (Figure 1). The cross section (Figure 2) shows the split frontal character of the cold front. The surface cold front consisted of an active precipitation band 50-100 km wide. Within this band of precipitation segments of line convection formed. In the passage of the surface front downbursts occurred causing considerable damage.
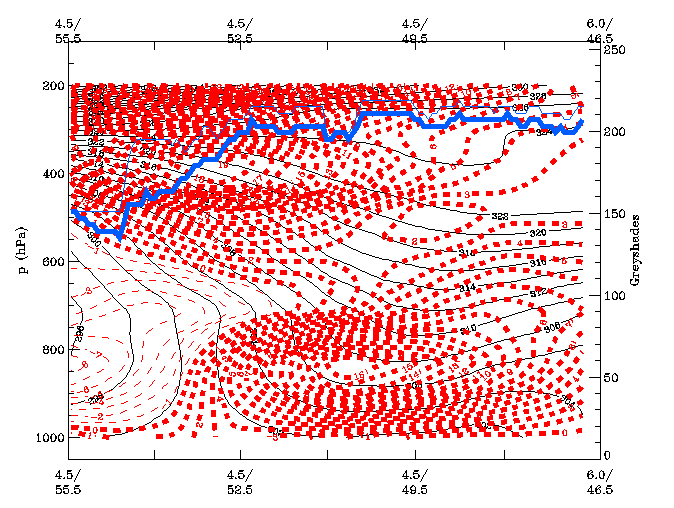
Figure 2. Vertical cross section isentropes (black) and temperature advection (red) 1 March 2008 00:00UTC – Source : ZAMG
After the passage of the upper level cold front the Airmass image shows an inflow of dry stratospheric air (red colours). However, up till 700 hPa the troposphere was characterised by warm and moist air leading to a potentially unstable situation. This situation is also well observed in the different radio soundings that we were able to retrieve for the storm path.
The convection is triggered by rising air in the upper part of the moist layer. The rising motions were caused by an increased Positive Vorticity Advection (PVA), situated in the left exit region of the Jet (aligned to the Cold Front). One also has to take into account that at low levels (1300 m) there was already a strong wind of up to 40 m/sec. near the surface this was only 10 m/sec. This difference in speed leads to a large shear. This is ideal for the development of line convection within a cold front (Bader et al., 1995). Within the line convection a strong vertical exchange of impulse is present, which in turn can lead to downbursts at the surface in which the wind speed equals those in the upper layers. The passage of this line marks the boundary of cold and dry air.
Split front that are characterised by a strong postfrontal flow give the indication of the presence of severe line convection. The strong windshear in the boundary layer are causing the development of segment of line convection in which a PVA in the left exit region of the Jet is the trigger. An exchange of impulse with the upper layers of the troposphere is the cause of downburst wind. From a satellite point of view the Forecasters should monitor the Airmass image closely and look for the signals of the dry intrusion, the position and orientation of the jet, and the overrunning dry air which was seen in this Emma storm but also in the Kyrill storm which was a clear sign of the potential instability with the warm moist air in the lower layers and the dry stratospheric air above. In combination with a strong windshear in the boundary layer the occurrence of line convection with strong downbursts is likely!