Chapter III: Total Precipitable Water (TPW) Products
Table of Contents
- Chapter III: Total Precipitable Water (TPW) Products
- TPW products from geostationary orbiting (GEO) satellites
- TPW products from low earth orbiting (LEO) satellites
TPW products from geostationary orbiting (GEO) satellites
TPW retrieval from GEO satellites is done by imager and sounding instruments. In 2014, TPW products were available from the SEVIRI sensor (imager) onboard Meteosat 8, 9 and 10, and from the sounders on board U.S. GOES 13, 14 and 15. They will also be available from the ABI (Advanced Baseline Imager) sensor on board GOES-R (projected launch in April 2016). The SEVIRI and the future ABI sensors scan the atmosphere in the visible and infra-red spectral ranges. The retrieval algorithm is very similar for both sensors and uses data from spectral channels in the IR range from 6 to 13 µm. U.S. GEO satellites have been able to derive total precipitable water (and other instability parameters) from their sounder instruments since the development of the experimental products on GOES-8 in the mid 1990's. The GOES Sounder TPW product became operational with round the clock support (24 x 7 x 365) in the early 2000's. See http://cimss.ssec.wisc.edu/goes/sounder/products.html for a short write-up and http://www.ssd.noaa.gov/PS/PCPN/pcpn-na.html for the current operational products.
In addition to the accumulated water vapour (TPW) product from the various geostationary satellites, a "Layer Precipitable Water" product (LPW) that is subdivided into three layers is also produced. The vertical extent of these layers varies depending on the properties of the sensors. For the above-mentioned instruments, they are defined as follows:
| Layer | SEVIRI | GOES Sounder | ABI |
|---|---|---|---|
| Boundary Layer | 1000 - 850 | 1000 - 900 | Surface - 900 |
| Middle Layer | 850 - 500 | 900 - 700 | 900 - 700 |
| High Layer | 500 - top | 700 - 300 | 700 - 300 |
Table 1: Vertical extent of the LPW product from SEVIRI, GOES Sounder and the future ABI instrument in [hPa].
The exact vertical extent of the three layers also depends on the overall synoptic situation as the pressure can drop below 900 hPa in the center of some low pressure systems. In other cases, such as over high altitude areas, pressure at the surface may be lower than 700 hPa.
Some TPW Products from different GEO satellites are:
- The Global Instability Index (GII) from EUMETSAT (Figure 1) which includes a TPW product
- The SEVIRI Physical Retrieval product (Figure 2) from the NoWCasting-SAF (www.nwcsaf.org)
- Current GOES (13, 14 and 15) Sounder TPW Product (Figure 3) (www.ssd.noaa.gov/PS/PCPN/pcpn-na.html)
- The future TPW product from the GOES-R ABI sensor
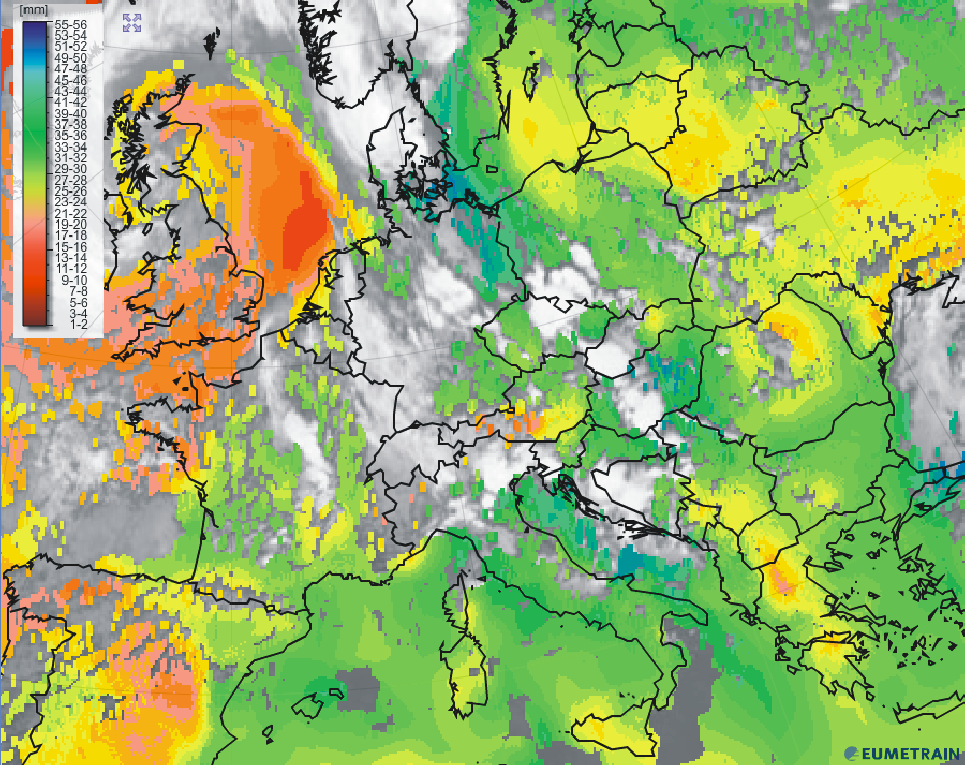
Figure 1: TPW product from EUMETSAT on 3 August 2014, 12:00 UTC. The amount of precipitable water is given in millimetres.
|
|
|
|
Figure 2: LPW boundary layer (top left); middle layer (top right); high layer (bottom left) and TPW (bottom right) on 1 September 2014, 05:30 - 13:00 UTC. Click on the animation to enlarge it.

Figure 3: Operational GOES sounder-derived product "precipitable water" on 8 January 2015 at 08:00 UTC.
The calculation of TPW products involves assumptions on the vertical profile of temperature and humidity. Both parameters can also be used to derive indices reflecting atmospheric stability. For this reason TPW products are often derived in a software package including stability parameters such as the Lifted-, K- or Showalter index. In fact, the combination of TPW fields with stability information is often beneficial and will be shown in the next chapter.
For the TPW product based on SEVIRI, GOES Sounder or future ABI data, TPW can only be retrieved from clear sky pixels. Information from cloudy pixels must be provided beforehand by a cloud mask. Background numerical weather profiles are a mandatory input to the TPW algorithm. The limited number of spectral channels compared to sounding instruments onboard polar orbiting satellites has implications on the vertical resolution of retrieved temperature and humidity profiles. As far as the SEVIRI sensor is concerned, water vapour concentration can be retrieved from the upper and middle troposphere down to approximately 700 hPa. Lower levels and especially the boundary layer are invisible for both SEVIRI WV channels (6.2 and 7.3 µm). Background NWP parameters are needed to correct this detriment. As a result, the derived TPW values are strongly biased towards NWP values.
On the plus side, TPW products from geostationary sensors (except GOES Sounder) are available every 5 minutes in rapid scanning mode. In situations with strong discrepancies between NWP profiles and measured atmospheric conditions, satellite-derived TPW values are corrected accordingly.
Note
TPW products from low earth orbiting (LEO) satellites
LEO microwave satellite products were developed with the idea of both complementing and supplementing the more timely and frequently produced geostationary satellite imagery. LEO microwave satellite products are unique in providing added value to the data received from GEO satellites to improve the analysis and forecast of precipitation.
LEO satellites pursue a different scanning strategy compared to geostationary satellites. Most of them circle around the globe from pole to pole in a Sun-synchronous orbit, that is, they pass the equator at approximately the same local time.
Because of their low orbit, these satellites scan the Earth's atmosphere in stripe-like swaths (see the Youtube video below). This leads to wider gaps between the scans closer to the equator and more overlapping scans the closer to the poles.
Some LEO satellites have a near-equatorial orbit, "wobbling" around 0° latitude. Data from these satellites does not cover the whole globe; instead, they provide a higher data frequency in tropical regions. One of the most prominent instruments measuring the amount of atmospheric water vapour in the tropics is the TMI instrument onboard NASA's TRMM satellite.
Blending technique for LEO microwave TPW Products
In contrast to the present generation of geostationary satellites with their limited sounding abilities, polar satellites carry a wide range of highly specialized atmospheric sounding instruments. These instruments generate vertical profiles of temperature and humidity for each overpass. Due to their scanning geometry and low altitude overpasses, the retrieved temperature and humidity profiles exhibit a detailed vertical structure (see the webcast on "Instruments on board Polar and Geostationary Satellites"). This profile data is used in the initialization process of NWP models and can also be used by forecasters to add value to short term forecasts.
Modern TPW retrieval algorithms combine the data from many sounding instruments on various polar satellites into one unified global product image, so forecasters don't have to spend time looking at many different satellite images of TPW. This is beneficial to the forecaster in that their forecasts of hazardous weather can now be made more timely and accurate. Such products are called "blended" products. The Cooperative Institute for Research of the Atmosphere (CIRA) at Colorado State University has an experimental polar orbiting microwave layer precipitable water (LPW) product that is being used by forecasters in the United States and can be seen here. These four layers of precipitable water vapour (surface to 850 hPa; 850 to 700 hPa; 700 to 500 hPa; 500 to 300 hPa) are constructed using the combined microwave instruments onboard the NOAA, MetOp, DMSP and NASA Aqua satellites. MIRS (Microwave Integrated Retrieval System) retrieves many variables from these microwave sounding instruments, such as "Layer Precipitable Water" (LPW), "Layered Relative Humidity" (RH) and vertical RH profiles. The algorithm allows the retrieval of LPW over land and sea (Figure 4).
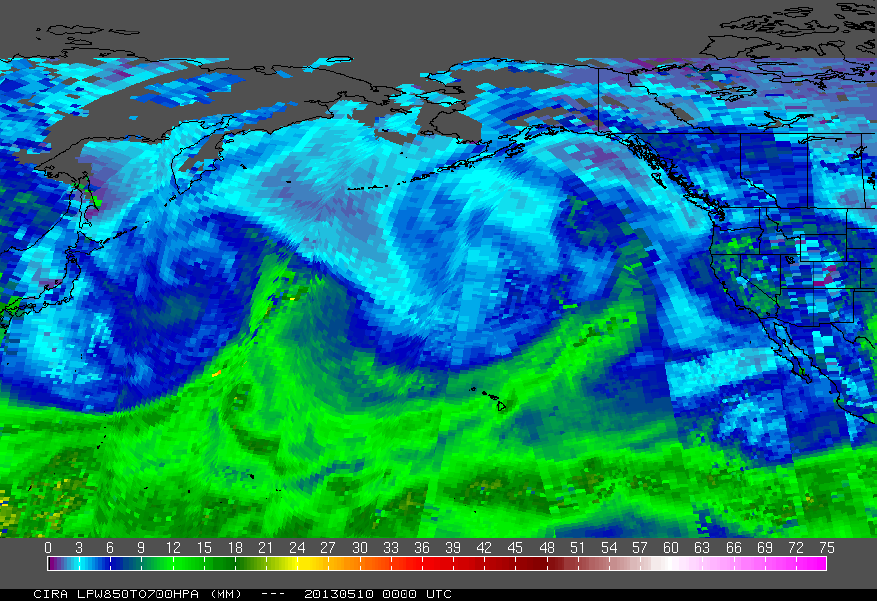
Figure 4: MIRS LPW product from CIRA from 10 May 2013, 00:00 UTC. The amount of precipitable water (850-700 hPa) is given in millimetres.
Although LPW products from microwave sensors give the total amount of water vapour from layers between the land/ocean surface to the top of the atmosphere, in practice, it shows the lowest 1 to 3 km of the troposphere with more accuracy than the GEO instruments. This microwave instrument characteristic is of high importance as the lower atmospheric layers contain most of the water vapour. This is due to the uneven vertical distribution of WV in the troposphere (Kusselson, 1993).
LPW products from LEO microwave instruments thus have a different focus than LPW products from GEO satellites. While the latter are better at tracing the repartition of water vapour in the higher parts of the atmosphere, microwave instruments show the humidity flow in the boundary layer better.
Morphing technique for LEO microwave TPW Products
Microwave passes from polar satellites are narrow, from about 1000 to 2000 km wide. The horizontal resolution of the product depends on the resolution and strategy (single polarization on NOAA/METOP AMSU; dual polarization/ conical scanning on DMSP SSMIS) of the scanning instrument/sensor and ranges from 45 km (at nadir) to 75 km for the AMSU-A instrument and approximately 42 by 70 km for the SSMIS, for example. Displayed TPW products from sounding instruments show a much coarser resolution than image data from geostationary satellites. However, LEO sounding instruments can retrieve information in cloudy areas whereas GEO instruments cannot.
Each satellite pass is separated in time from the adjacent one by about 100 minutes. When plotting scans on a domain, TPW data stripes from different time steps are laid side by side. In order to create a time consistent image of TPW data, older overpasses are processed using model winds before being merged with more recent overpasses. To reduce the time gap between overpasses and thus increase data frequency, microwave data from several satellites are included, so morphing and blending are used side by side.
The procedure of morphing different satellite overpasses is generally employed to visualize TPW data on domains as static image or loop. In doing so, a swath scan is then advected backward and forward in time using the mean layer wind field in order to create synthetic hourly data (Figure 5). The final product is a composite of many "time-corrected" TPW swaths over a selected domain. As an example product which uses the morphing technique, see the MIMIC-TPW product at CIMSS.
Figure 5: Example of a swath scan being advected back and forth in time. Source CIMSS.
Currently, the CIMSS Morphing Blended TPW Product does not produce water vapour concentration over land (Figure 6) and uses real-time data from the SSM/I sensor on the DMSP-13/14 satellites and the AMSR-E sensor on the Aqua satellite. Another satellite-derived TPW Product that does show precipitable water vapour over land and includes TPW retrievals from the NOAA and METOP satellites is the NOAA/NESDIS Blended TPW Product. It fills in TPW gaps over land with other data sources; over the continental U.S. it uses a blend of GOES sounder satellites, GPS-MET remote sensing sites and MIRS. For the rest of the world it uses MIRS-derived TPW only, with the exception of areas covered by snow; retrievals over snow are currently experimental and will be added in the future.
The strength of morphed LPW and TPW products is an increased and more uniform sounding coverage attained by calculating time-weighted averages from sounding data. Weaknesses of morphed TPW products are discontinuities in the image data which can occur due to incorrect swath advection over longer time periods.
Figure 6: Morphed composite image loop of TPW (9 August 2014, 07 UTC to 12 August 2014, 06 UTC). Source CIMSS.
TPW anomaly products
TPW anomaly products help forecasters compare the present distribution of the amount of TPW in a given region with a climatological normal produced from the NASA Water Vapour Project that used LEO microwave-derived TPW from satellites between 1988 and 1999. The forecaster's attention is drawn to percentage values of much below (less than 25% below normal), below (between 25 and 90% of normal), near normal (90 to 110% of normal); above (110 to 200% of normal) and much above normal (greater than 200% of normal). High percentage values indicate a strong potential for heavy precipitation and flooding, especially when precipitable water is released either by convection, orography or large-scale lifting initiated by an upper level jet, diffluence and/or a baroclinic disturbance (a tight upper trough, vorticity advection). The percent of normal product of the TPW has proven useful for tracking the climatology of moisture bands (the so-called 'atmospheric rivers') and following their tracks both over water when they approach land and when they extend over land. Furthermore, a percentage much below normal TPW over land for a longer time period can also indicate a danger of fires. (see NESDIS Operational Blended TPW Products)
Moisture anomalies with values of 150% above normal are usually related to heavy precipitation and flooding. This product (Figure 7) allows forecasters to see the potential for high impact events more easily and track them with all the other types of satellite imagery.
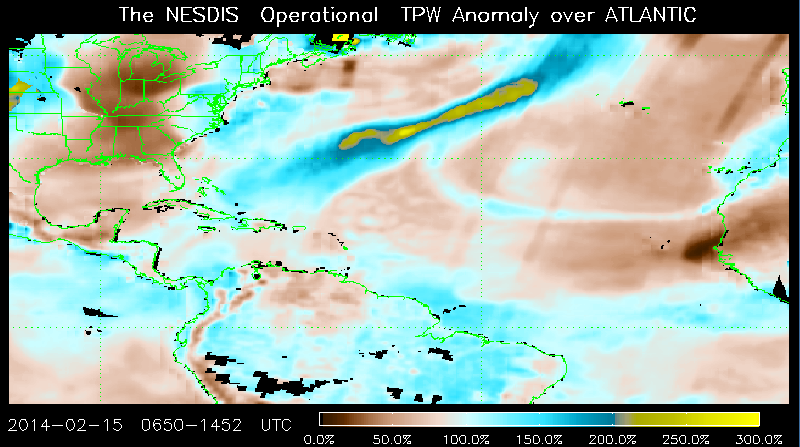
Figure 7: The NOAA NESDIS operational TPW Percent of Normal product over the Atlantic on 15 February 2014 at 15:00 UTC. Source NOAA.