Chapter II: Retrieving the Atmospheric Water Content
Table of Contents
- Chapter II: Retrieving the Atmospheric Water Content
- The concept of Total Precipitable Water (TPW)
- Description of the TPW Retrieval Method
- TPW retrieval from GEO satellites
- TPW retrieval from LEO satellites
The concept of Total Precipitable Water (TPW)
The vertical distribution of atmospheric water vapour is quite uneven since most of it is concentrated in regions below 700 hPa (~ 3 km). The concept behind TPW is to get an absolute measure of the water content of the air. It strongly differs from the more familiar relative humidity as the latter depends on the capacity of the air to hold water and hence on its temperature.
Assuming a vertical column of air reaching from the ground to the top of the atmosphere with a base of 1 m2, the TPW content of this column equals the amount of water if all water vapor was condensed. The commonly used units are [kg/m2] reflecting the weight of the condensed water or [mm] if water is accumulated on the bottom of the column.
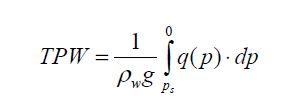
where Ρw is the water density, which is 1000 [kg/m3]; g is the gravitational constant 9.8 [m/s2]; q(p) is the mixing ratio (g/kg) of water vapor in hPa at pressure level p and ps is surface air pressure in hPa.
Note
In common usage TPW refers only to the gaseous form of water in the atmosphere, thus not taking into account water droplets from clouds. The latter is evaluated in so-called "Cloud Water Products".
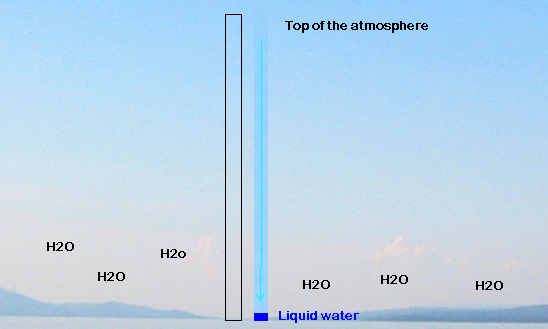
Figure 1: Schematic illustrating the concept of TPW. The left column contains air and water vapour, the right column contains dry air and condensed water vapour on the bottom of the column.
Description of the TPW Retrieval Method
One method to retrieve atmospheric TPW is to deduce it from the vertical profile of temperature and humidity.
Satellite sensors measure radiation emitted from the Earth's atmosphere, surface and clouds. Active sensors (e.g. RADAR) emit a signal and measure the time the signal needs to return to the sensor. The distance between sensor and reflecting object can be deduced from the time lapse of the signal.
Here, only passive instruments are considered for the retrieval of vertical temperature and humidity profiles. They receive radiation from the Earth's atmosphere without emitting a signal.
The main problems to solve are:
- How can we know from which atmospheric level the radiation comes from?
- How can we infer the vertical distribution of temperature and moisture from the received signal?
Let's start with a special case:
Some channels are so called "window channels". This means the radiation reaching the satellite is emitted from a surface (e.g. soil, snow, cloud water droplets, ...) and reaches the satellite instrument without interacting with the atmosphere. In this simple case, we just need to know that the measurement is not affected by clouds to get the surface skin temperature by applying the Planck formula which establishes a relation between the temperature and the radiation emitted by an object. As radiation emitting surfaces are usually not "black bodies", an emissivity correction term has to be applied.
Figure 2: In atmospheric windows, radiation from the Earth's surface directly reaches the satellite instrument without interacting with the atmosphere. In case of clouds, radiation from higher atmospheric levels (cloud tops) reaches the satellite. Credits: Marianne König (EUMETSAT)
Fortunately for our purposes, most channels are absorption channels, which means that atmospheric trace gases like ozone (O3), carbon dioxide (CO2) or water vapor (H2O) prevent a "clear view" from the ground to the satellite. Radiation emitted from the ground is "weakened" by trace gas molecules because they absorb the radiation and scatter it in all directions (Figure 3).

Figure 3: H2O molecules absorb the radiation energy emitted from the Earth's surface. Credits: Marianne König (EUMETSAT)
Some trace gases like water vapour are so obtrusive that all radiation arriving at the satellite instrument stems from the atmosphere alone, since all direct radiation from the ground has been absorbed on the way to the satellite (Figure 4).
Figure 4: Contribution profile of a water vapour absorption channel (red) compared to a window channel (blue). Credits: Marianne König (EUMETSAT)
For a better understanding of the retrieval method, imagine a landscape covered with thick fog. Depending on the thickness of the fog, you will be able to discern objects 100, 300 or even 600 meters away from you.
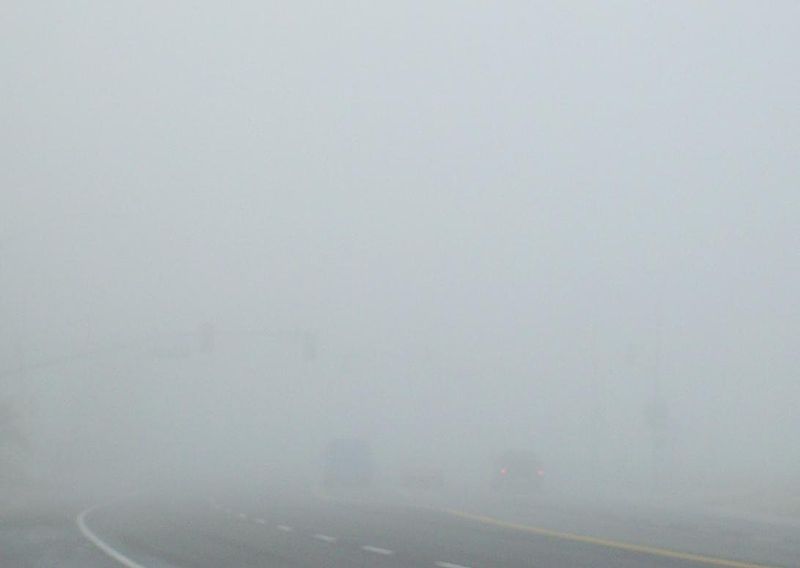
Figure 5: Dense fog on a motorway prevents a view of more than 50 meters. All radiation from greater distances is absorbed and scattered by the fog droplets.
By knowing the amount of radiation emitted from the ground (window channels) and by measuring the radiation in the absorption channels, the retrieval algorithm will estimate the amount and distribution of trace gases. Of particular importance is the vertical distribution of water vapour, which is one of the most effective absorbers and greenhouse gases in the atmosphere.
The retrieval algorithm thus tries to find an atmospheric profile of temperature and humidity that best reproduces the observations from the passive satellite instrument. In general, this is a multi-solution problem, i.e. many different vertical distributions of temperature and humidity would lead to the same measurement. Hence a so-called "background profile" is needed to provide a first guess as to the real state of the atmosphere. This background profile comes from a numerical model.
For many satellite measurements, this first guess will represent the real atmosphere adequately. In cases where synthetic radiances based on NWP profiles and satellite-measured radiances diverge, an iteration process is used to adapt the NWP profiles of temperature and humidity to the satellite instrument measurements. The radiation transmission model is recalculated with a modified NWP input until its output fits the observed radiation. The iteration process produces a modified profile which includes the primary NWP information corrected by satellite observations.
The temperature and humidity profiles thus derived are the basis for TPW, layer precipitable water (LPW) and stability parameters.
Note
TPW retrieval from GEO satellites
Geostationary satellites like Meteosat Second Generation (MSG) can provide information on the quantity of atmospheric water vapour although their sounding capabilities are limited.
Besides offering three window channels in the IR range, MSG-SEVIRI also provides two channels in the water vapour absorption band (6.2 µm and 7.3 µm). While the IR window channels are measuring the radiation emitted from the earth's surface (or cloud tops), both absorption channels reflect the amount of water vapour along the optical path from the radiation emitting surface to the satellite sensor.
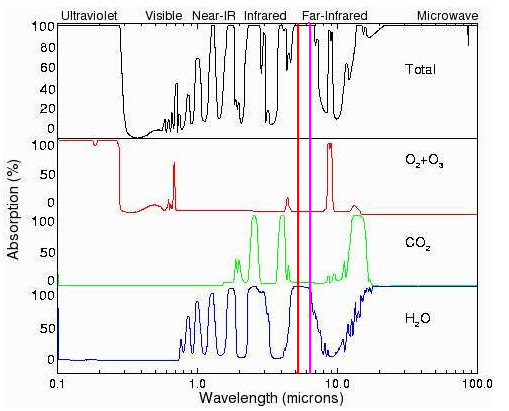
Figure 6: Absorption of radiation depending on its wavelength for selected atmospheric trace gases. The red line marks the 6.2 µm and the magenta line the 7.2 µm band.
Both channels lay in the water vapour absorption band which reaches from about 5 to 8 µm. While the channel centred around 6.2 µm is located in the middle of the absorption band, the position of the 7.3 µm channel is on the edge of the absorption band (Figure 6). The consequence is that surface radiation emitted at 6.2 µm is much more strongly absorbed by atmospheric water vapour than radiation at 7.3 µm.
In reality, all surface radiation is completely absorbed by atmospheric water vapour on its way to the satellite. Each absorbing VW molecule emits radiation according to Planck's law, mainly depending on its temperature. As a consequence, the satellite only "sees" the atmosphere - or, to be more exact, the radiation emitted by WV molecules.
Now, as the extent of the absorption differs depending on the wavelength, the satellite "sees" different levels of the atmosphere. This effect is comparable to the visibility range in fog of varying density. The different atmospheric layers contributing with emitted radiation from VW molecules to the satellite measured total (or integral) radiation is represented in so called "contribution functions" (Figure 7).

Figure 7: Contribution functions for MSG-SEVIRI IR channels (Source: EUMETSAT)
Figure 7 shows that radiation measured by the SEVIRI sensor at 6.2 and 7.3 µm (red and green line) originates from the mid- and higher levels of the troposphere. Hence we get information on water vapour content from 2 different atmospheric levels.
As the number of absorption channels is limited for currently operating GEO satellites and water vapour mainly concentrates in lower tropospheric levels, additional information (e.g. from numerical models) is needed to retrieve the TPW content.
Note
GEO satellite sensors (e.g. MSG-SEVIRI) provide WV information from mid- to higher tropospheric levels only.
TPW retrieval from LEO satellites
Sounding instruments on polar orbiting satellites
While the SEVIRI and the future ABI sensor on GEO satellites scan the Earth's atmosphere in the IR range (2 - 13 µm), sounding instruments on polar orbiters use the microwave bands in the range from about 5 - 200 GHz or 0.15 - 6 cm to chart the concentration of water vapour in the atmosphere. Microwaves are not blocked by cloud droplets or ice crystals and penetrate the whole atmosphere from its top to the boundary layer in all weather conditions, day and night. This makes them well suited for observing clouds, precipitation and water vapour.
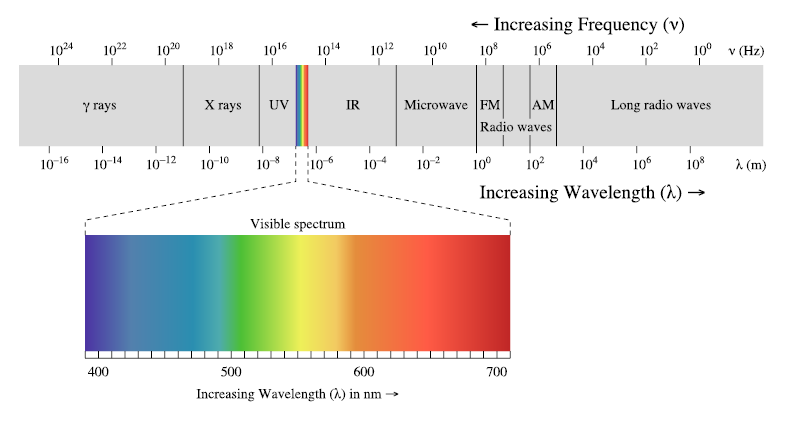
Figure 8: Schematic of the electromagnetic spectrum.
Instruments on polar orbiting satellites like
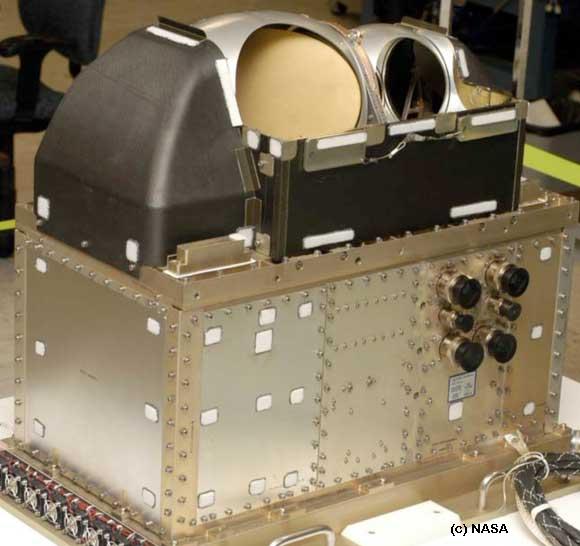
- the "Advanced Technology Microwave Sounder" (ATMS) on Suomi NPP satellite (see ATMS instrument)
- the "Special Sensor Microwave Imager/Sounder" (SSMI/S) of the DMSP satellites (see SSMIS instrument)
- the Microwave Humidity Sounder (MHS) on MetOp and NOAA satellites (see MHS instrumen)
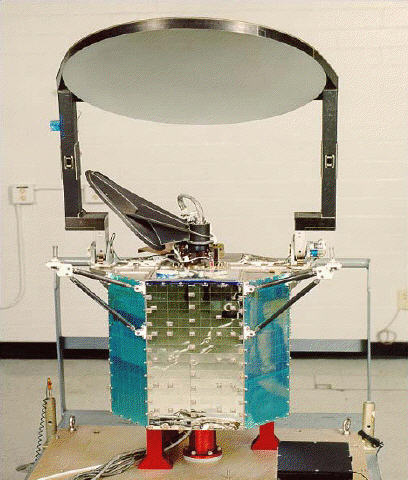
- the "Advanced Microwave Sounding Unit" (AMSU) on board NOAA and MetOp satellites (see AMSU A1 and A2 instruments)
are passive sensors measuring atmospheric and terrestrial radiation to provide vertical profiles of temperature and humidity. These sounders can provide image-based products too.
Various technical implementations are currently used to augment the instruments' field of view. For example, NOAA and MetOp AMSU/MHS instruments use the linear cross track scanning method. The disadvantage of this method is that the resolution of the AMSU instrument, for example, degrades continuously from 45 km at nadir to 75 km at the edge of the swath.
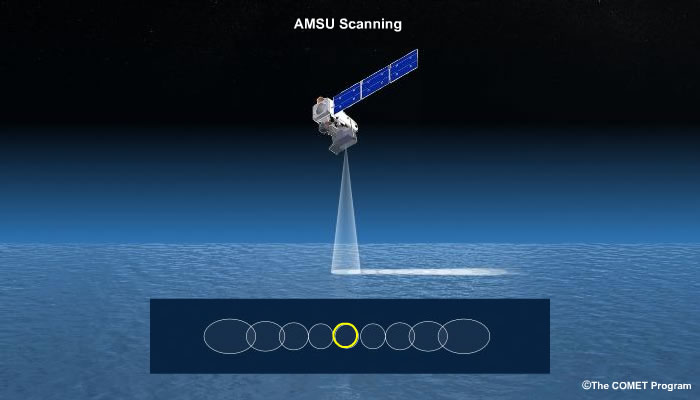
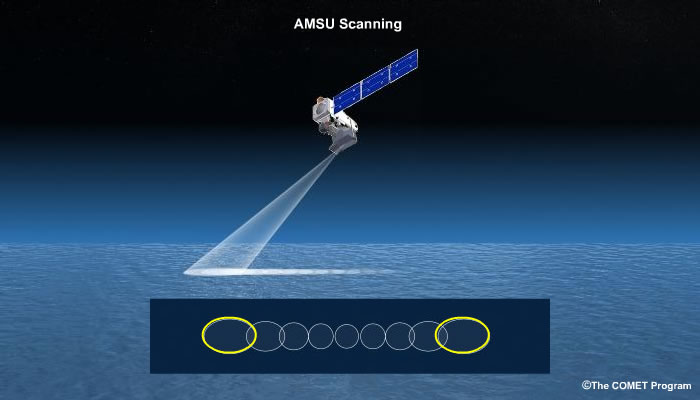
Figure 9: Linear cross track scanning principle. Lower resolution at high scanning angles compared to nadir view. © The COMET Program
The SSMI/S instrument on DMSP satellites employs another scanning strategy. The so-called conical scanning produces narrower scan widths but maintains the resolution across the entire swath.
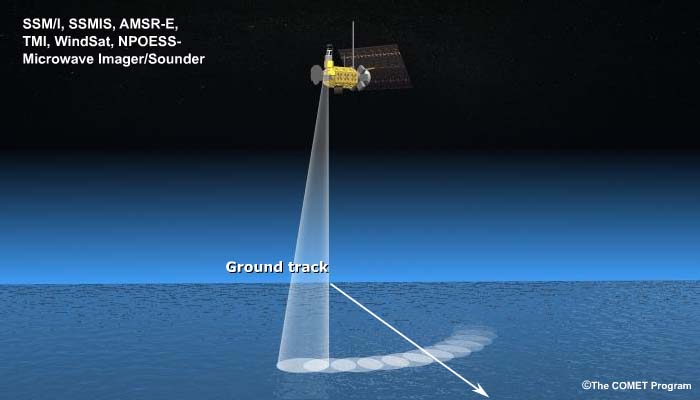
Figure 10: Conical cross track scanning principle ensures constant resolution with constant viewing angle. © The COMET Program.
The Radio Occultation Method
In contrast to the aforementioned microwave sounding instruments, the Radio Occultation (RO) method follows a horizontal (or, more precisely, tangential) sampling strategy. The basic principle of the RO method is that a receiver onboard a low-orbiting satellite tracks GPS (Global Positioning System) signals, as the transmitting satellite sets or rises behind the Earth (Figure 11). Due to refraction in the ionosphere and the neutral atmosphere the GPS signal is delayed and its path bent, enabling calculation of the index of refraction (or refractivity) and subsequently temperature and humidity as a function of height.

Figure 11: The figure shows how radio signals from GPS satellites (left) are bent by the atmosphere and received by the RO instrument (right). Several consecutive measurements result in a vertical profile of humidity and temperature (white line).
The RO method is an indirect measurement of temperature, pressure and water vapour in the atmosphere from vertical profiles of the refractive index. This method provides absolute water vapour content or partial pressure rather than relative humidity. This makes it particularly useful for obtaining a measure for the total water vapour content in a column of the atmosphere integrated from surface to space.
Bending angles are provided for altitudes ranging from 80 km down to the ground. Hence, RO measurements provide vertical information of temperature and humidity of the low, middle and high troposphere (and above). Each RO profile consists of approximately 3000 rays. About 500 vertical profiles are compiled per day and RO instrument.
Profiles are distributed over the globe irregularly, though still providing a good global coverage. RO yields a high vertical resolution of about 100 m while the horizontal resolution is poorer with ~ 200 km. RO paths are only marginally affected by clouds, aerosols or precipitation.
The primary field of application for RO profiles is assimilation into NWP models and climate observations. As they are retrieved with identical accuracy over land and sea, TPW from RO profiles can be used to complement TPW plots from microwave sounding instruments (see next chapter).