Example: 3rd August 2014
Introduction
The selected case demonstrates the benefits of the GEO TPW product together with the GII analysis. The satellite loop below shows the development of convective cells on 3 August 2014 in hourly steps.
Figure 15: MSG SEVIRI 10.8 µm loop (3 August 2014, 00 - 23 UTC)
The current EUMETSAT GII product is aimed at helping forecasters to turn their attention to a certain region, which they can then monitor more closely with other means over the next several hours, such as satellite imagery, radar and lightning data. The MSG GII data have proven to provide lead times between 6 and 9 hours.
The synoptic situation over Central Europe on 3 August 2014 is characterised by weak pressure gradients near the surface and the absence of frontal zones. A low pressure system over the Irish Sea has only marginal influence on weather in Central and Eastern Europe.
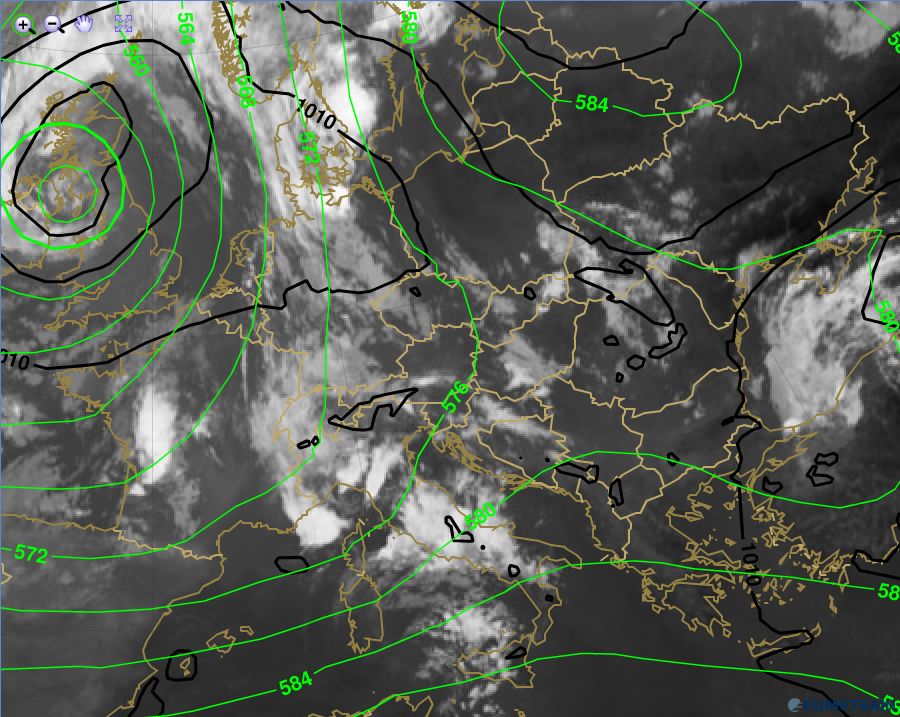
Figure 16: MSG SEVIRI IR 10.8 m image with ECMW surface pressure in hPa(black) and 500 hPa geopotential height in decameters (green) on 3 August 2014, 06 UTC.
The next chapters will show the evolution of convection in the different regions of Europe on 3 August 2014 for 06, 12 and 18 UTC. A closer look will be given to both, the GII (Lifted Index) and the TPW product.
Convection hot spots can already be found at the beginning of the day in some regions of Europe (France, Italy and Scandinavia). More severe convection was expected with the ground warming up during the course of the day.
To give an answer to the question which regions in Europe present a favourable environment for the development of severe thunderstorms in the next 6 to 9 hours, we should have a look at the Lifted Index (LI) and the TPW product.
 |
 |
 |
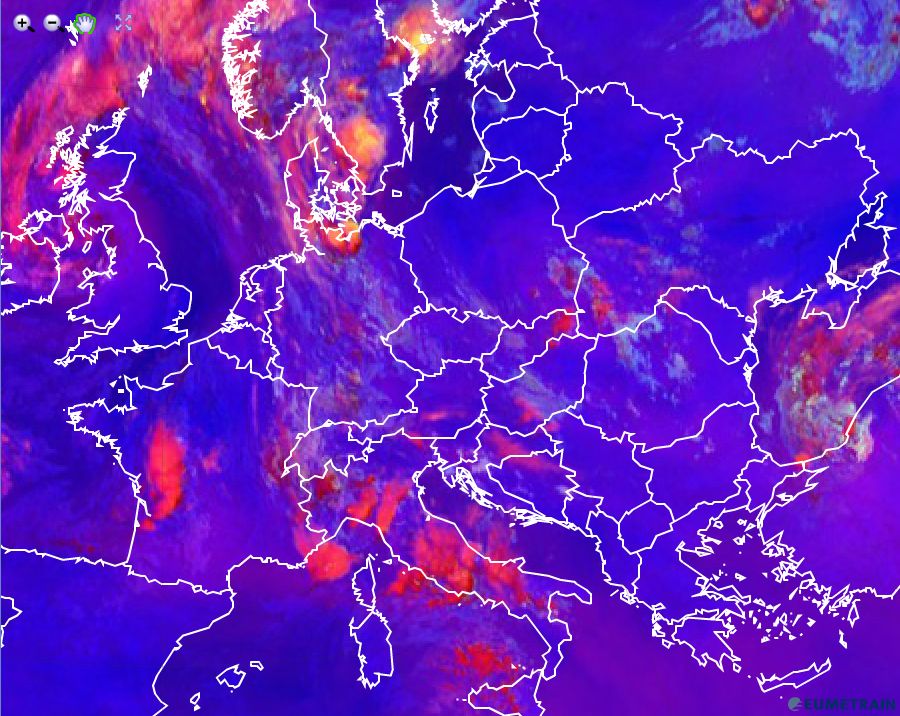 |
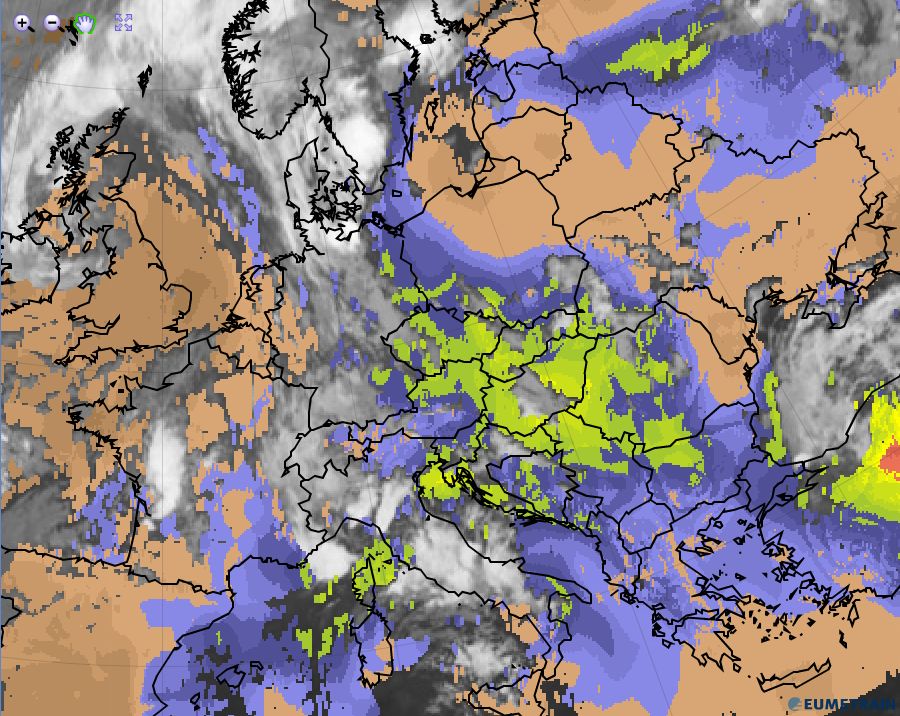
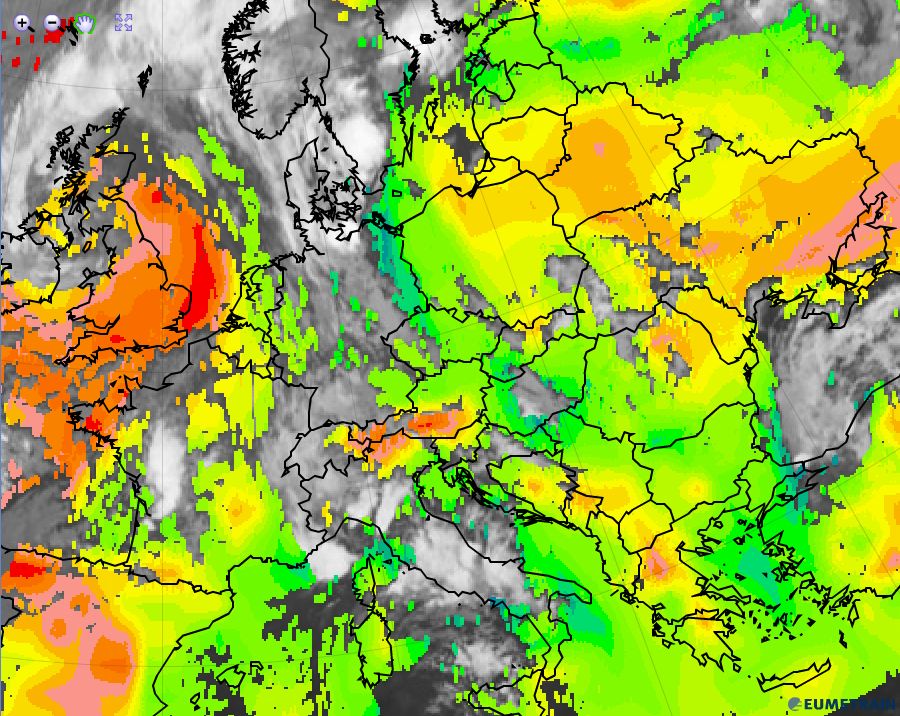
Figure 17a-17d: IR 10.8 µm with GII product (top left); IR 10.8 µm with TPW product (top right); WV 6.2 µm with TPW product and 850 hPa model wind (bottom left); Severe Storm RGB (bottom right) for 3 August 2014, 06:00 UTC. To enlarge an image, press on it.
Figure 17a:
Apart from the seas around Italy, where active convective cells can be found as early as 06 UTC, there is a broad line with low LI values (reflecting unstable air masses) that stretches from South Sweden to Greece. This line's lowest values reach from the Czech Republic and eastern Austria to Romania and Serbia. We can also observe an extended stable area over the British Isles (center of the low) and another one reaching from the Baltic States to the Black Sea.
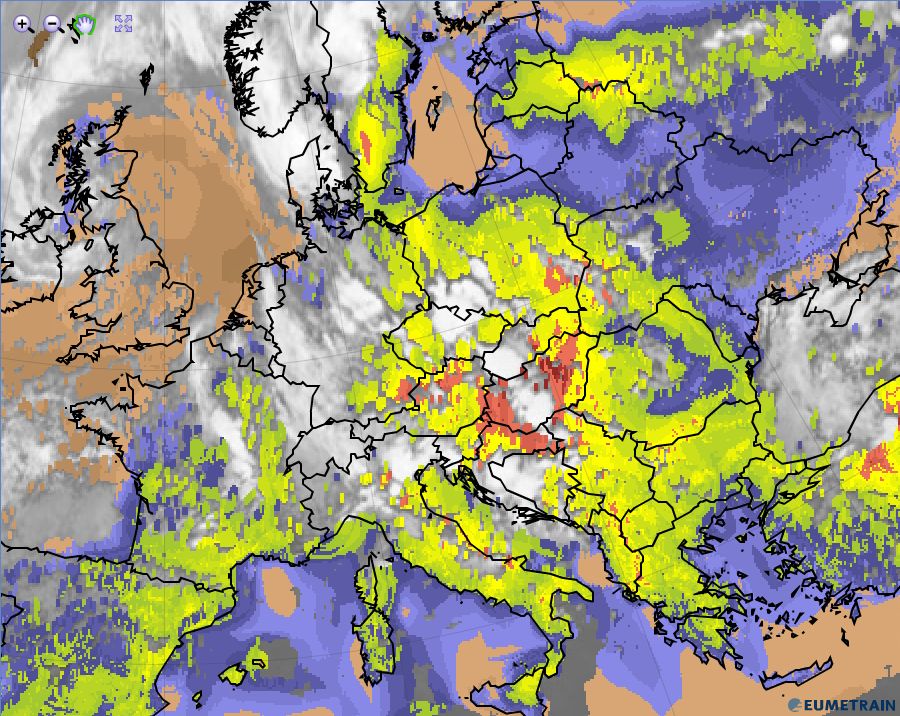
Figure 17b:
The GEO TPW product at 06 UTC shows a high amount of precipitable water in the region corresponding to the lowest LI values. Hence, we can expect that once convection initiates in the instability band reaching from southern Sweden to Greece, the high amount of water vapour (moisture) would be readily available to produce heavy rainfall. Of special interest is a region in the eastern Alps (South Tyrol and southern Austria) with very low TPW values right in the middle of high TPW values and surrounded by active convective cells. As this minimum of TPW is not reflected in 6.2 µm WV images, the relatively low amount of moisture results from the elevated terrain.
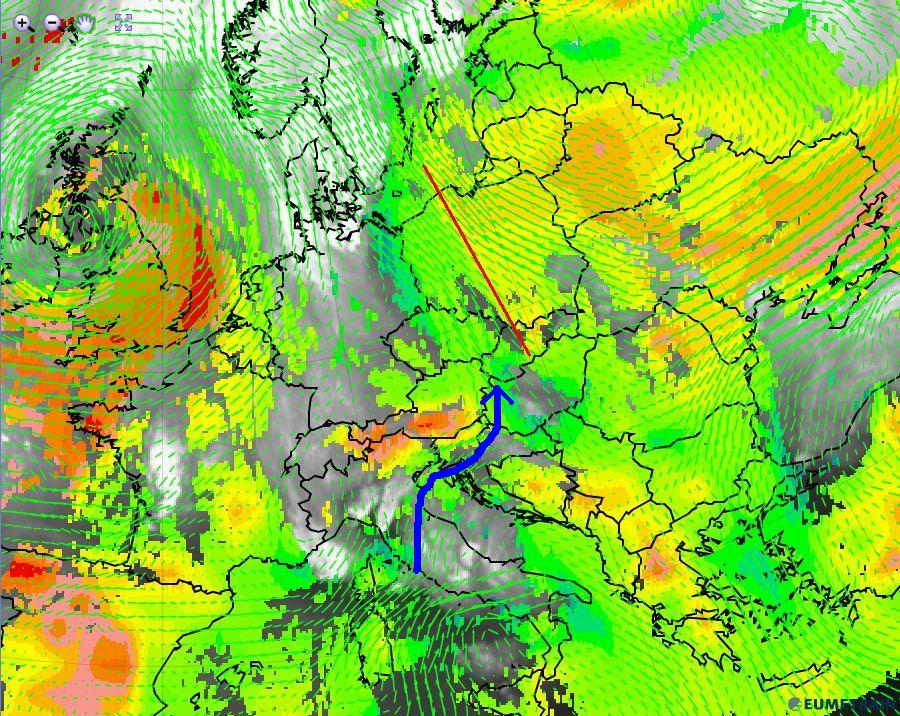
Figure 17c:
The wind field at 850 hPa shows the advection of dry continental air from the Ukraine towards the Baltic States and Poland where we can observe a pronounced TPW gradient (red line).
Moist and warm air is advected from the Mediterranean Sea towards Italy where MCSs form when the moist air comes over land. The air stream is blocked by the mountain range and turns to parallel the Alps (blue arrow); the dry region in the south-eastern part of the Alps shows little or no wind. There is a high pressure zone at ground level (figure 16) right at the location of the TPW minimum. This high pressure zone seems to originate from the blocked air stream towards the southern flank of the Alps. An inversion at lower levels (figure 19, next chapter) combined with rather small wind speeds makes the southerly wind follow the Alps.
Figure 17d:
The Severe Storm RGB depicts the hot spots of convective activity at 06 UTC:
- Western France
- Italy
- South Scandinavia
The yellow-orange colour within Scandinavian MCS is a sign of high activity in contrast to the more reddish cells over Italy.
Summary:
At 06 UTC, satellite data shows ongoing convective activity over large parts of Europe. The GII image shows a wide region of instability with high TPW values reaching from southern Scandinavia to Greece. In contrast, dry air masses can be seen in TPW images extending east from Poland and over the southeastern Alps, Greece and Spain.
According to LI and TPW data at 06 UTC, convection is expected to extend over eastern Europe (moist and unstable region), while it should be suppressed over eastern Poland, Belarus and Ukraine and in a small window south of the Alps due to limited water vapour supply.
At 12 UTC we see the development of large convective cells (MCS) in the area indicated by LI and TPW 6 hours before (south-west Poland to Hungary). The IR-loop (figure 15) shows decaying convective cells in the Alpine region where low TPW values were identified. While mountains usually trigger convection, neither wind (blocking), neither stratification (inversion) nor available water vapour acts in favour of convection.
 |
 |
 |
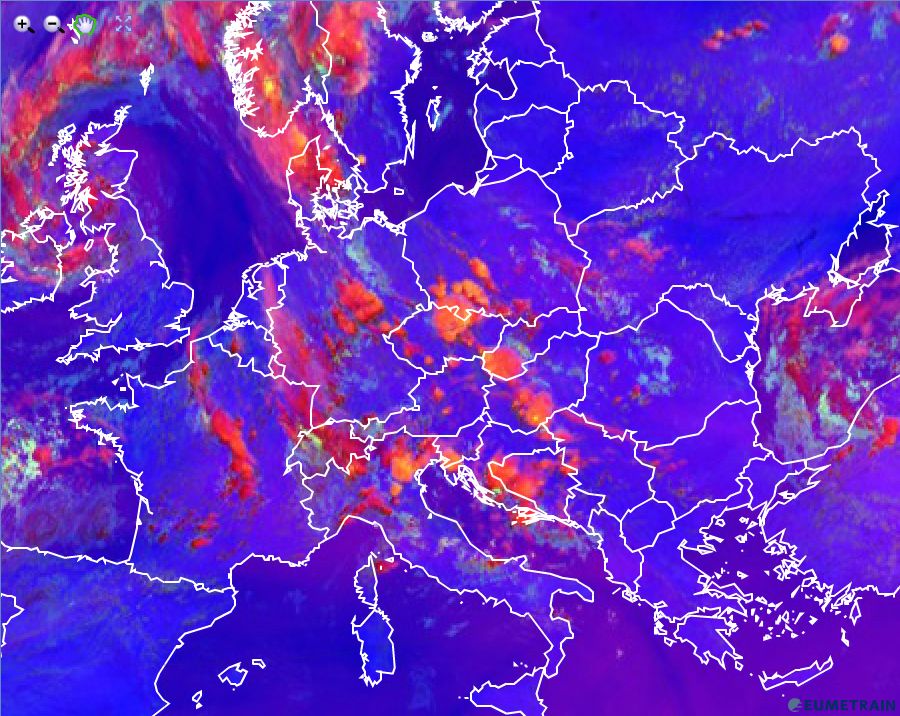 |
Figure 18a-18d: IR 10.8 µm with GII product (top left); IR 10.8 µm with TPW product (top right); WV 6.2 µm with TPW product and 850 hPa model wind (bottom left); Severe Storm RGB (bottom right) for 3 August 2014, 12:00 UTC. To enlarge an image, press on it.
Figure 18b:
While the LI product shows unstable stratified air masses over Spain and Greece at 12 UTC, the TPW field is very similar to the one at 06 UTC. TPW values are low in these regions and therefore can inhibit the development of thunderstorms.
Low TPW values match the rather stable region (Baltic States to Ukraine). In the small Alpine area with dry air, convection is damped and the transgressing convective cells seem to weaken (see Figure 20).
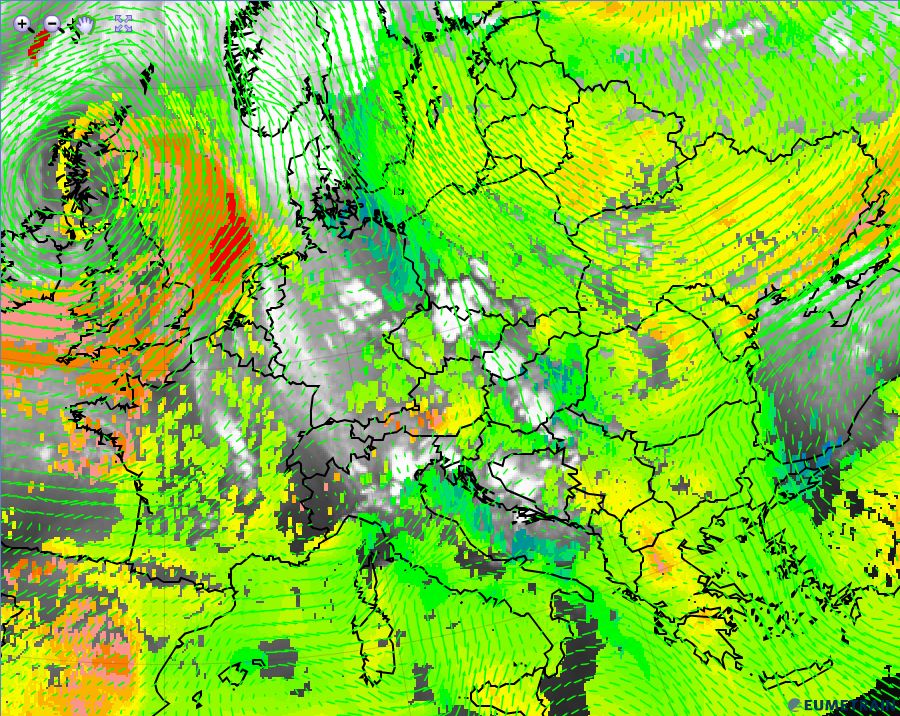
Figure 18c:
The convective line (Poland to Hungary) is well reflected in WV imagery at 6.2 µm.In the Alpine region we still see a cloud window with very low TPW values. While model winds at 850 hPa indicate a mountain overflow, the satellite loop still shows a bypassing of the flow. Radiosonde data from Udine (Figure 19) shows a capping inversion at 800 hPa. Convection concentrates over northeast Italy, Slovenia, Croatia and Montenegro.
Figure 18d:
The Severe Storm RGB shows intense convection over the following regions:
- South Scandinavia
- Germany
- France
- Poland to Hungary
- North of the Adriatic Sea (Italy to Montenegro)

Figure 19: 12 UTC radiosonde data from Udine (NE-Italy) station (3 August 2014). The red line marks the inversion height.
Summary:
At 12 UTC, the LI product shows wide spread instability over the European continent. Nevertheless, the availability of water vapour (TPW) sets limits to the development of convection in some regions.
In the Alpine region, blocking, inversion and low TPW values lead to the inhibition of thunderstorms as can be seen in the cell track image (Figure 20).
For completeness it should be mentioned that many variables contribute to initiating and intensifying convection, which can lead to heavy rains. Likewise, there are many variables that can inhibit cloud formation or convective development. Forcing mechanisms are also very important. Example mechanisms include negative LI values, jet interaction, vorticity advection (small comma clouds, for example), diffluence, deformation, etc.
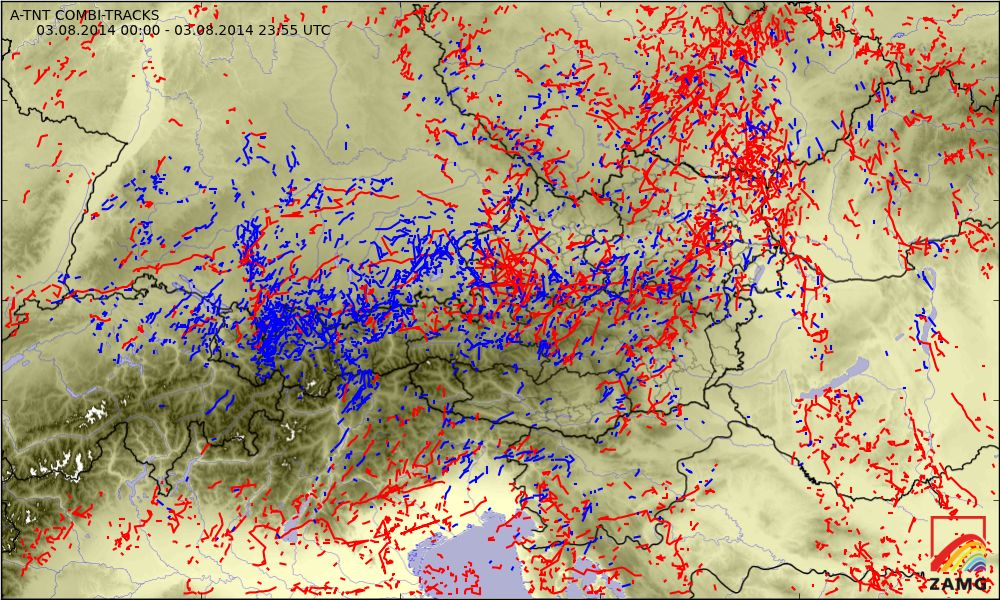
Figure 20: Convective cell tracks from Radar and lightning data for 3 August 2014. Red lines represent cells with confirmed lightning, blue tracks represent cells with rain only.
The late afternoon and evening hours usually mark the peak of convective activity and the time when convection forecasts issued the previous morning are verified.
Figure 21: IR 10.8 µm satellite image from 3 August 2014, 18 UTC and 5 minutes interval lightning data superimposed.
Figure 21 shows lightning activity over central Europe on 3 August 2014 at 18 UTC. The area of instability derived from the LI image and TPW product provided a good forecast for the regions where convective activity actually developed during the day
On the other hand it also showed where the development of thunderstorms was suppressed by a relative minimum/low TPW. Those regions remained largely free of convection all day long though air masses were or became unstable.
-
The region from the Baltic States to the Ukraine:
Dry, stable air was advected continuously from Russia. Although stratification became unstable in the course of the day, major convective cell did not develop. -
Spain and Greece:
While Greece already showed negative LI values at 06 UTC, both regions showed low TPW values and remained free of convection. Increasing instability at 12 UTC did not lead to convection in the afternoon. -
Alpine region (South Tyrol and southern Austria):
This small area in the eastern Alps was probably the most interesting region during this day. Although surrounded by intense convection, it remained largely free from convective activity. This can be seen in figure 22, where the IR image depicts a cloudy but not convective sector. In this case, low TPW values may have resulted from the higher terrain, and the low TPW values may have been one factor inhibiting convection, though probably not the main one. It is possible that a larger impact on convective inhibition came from the broken to overcast cloudiness - remnants from the previous evening's convection - which did not clear much throughout most of the day.

Figure 22: IR satellite image from 3 August 2014, 18 UTC and 5 minutes interval lightning data superimposed. The red line contours the region with low TPW values and inhibited convection.
Conclusion:
In this case the combined use of stability parameters and the TPW product was helpful for predicting areas with convective development.
Among the multitude of factors influencing convective initiation, the availability of sufficient moisture to sustain convection is one of the crucial ones. In this case satellite-derived TPW products were certainly a useful tool for forecasters. However, other factors that may have an effect on TPW have to be considered as well: on one hand, instability parameters like LI, and on the other, shortwave forcing, diffluence and deformation depicted in satellite images and loops.
Note
Neither TPW nor LI are an indication of inhibited or strengthening thunderstorm development by themselves. Any such development will involve a complex balance of both factors; both TPW, LI and their trends need to be taken into account.