Heavy Snowfall Event in Slovenia and Southern Austria (30 January - 1 February 2014)
Initial Phase (29 January, 00 UTC - 30 January 12 UTC)
Figure 3: MSG SEVIRI IR10.8 µm loop (29 January 2014, 00 UTC to 30 January 2014, 12 UTC).
During the initial phase, we see the development and southward progress of a massive cold air outbreak over the Bay of Biscay and the Iberian Peninsula starting on 29 January. This is the starting situation for an exceptionally strong precipitation and snowfall event towards the end of January 2014 on the southern side of the Alps.
In the above satellite loop (Figure 3), we see the formation of a frontal system centered west of the Gulf of Genoa on 30 January. This kind of cyclogenesis is quite frequent during the winter season in this region and known by forecasters as having the potential to cause severe orographic rain or snowfall along the southern side of the Alps.

Figure 4: MSG Air Mass RGB with isotachs [m/s] at 300 hPa, 30 January 2014, 12 UTC.
As a consequence of the deepening of the surface low, the propagation of the system towards the east is slowed down. Moisture transport from the south towards the north increases with the strengthening of the low. Figure 4 shows a pronounced jet streak reaching from tropical Africa towards Italy. This impressive stream marks the upper limit of a moisture flow from moist tropical regions towards central Europe.
Culmination Phase (30 January, 13 UTC - 1 February, 23 UTC)
Figure 5: MSG SEVIRI IR10.8 µm loop (30 January 2014, 13 UTC to 1 February 2014, 23 UTC). The red line shows the batch of moist warm air causing high snowfall rates.
During the phase of maximum precipitation and snowfall activity, we can identify the rising warm and moist air masses over continental cold air over northern Italy, Slovenia and the southern part of Austria. The formation of a warm front is a clear sign for this process. On the first of February a second cold air outbreak over western Europe boosts the northward stream over central Europe.
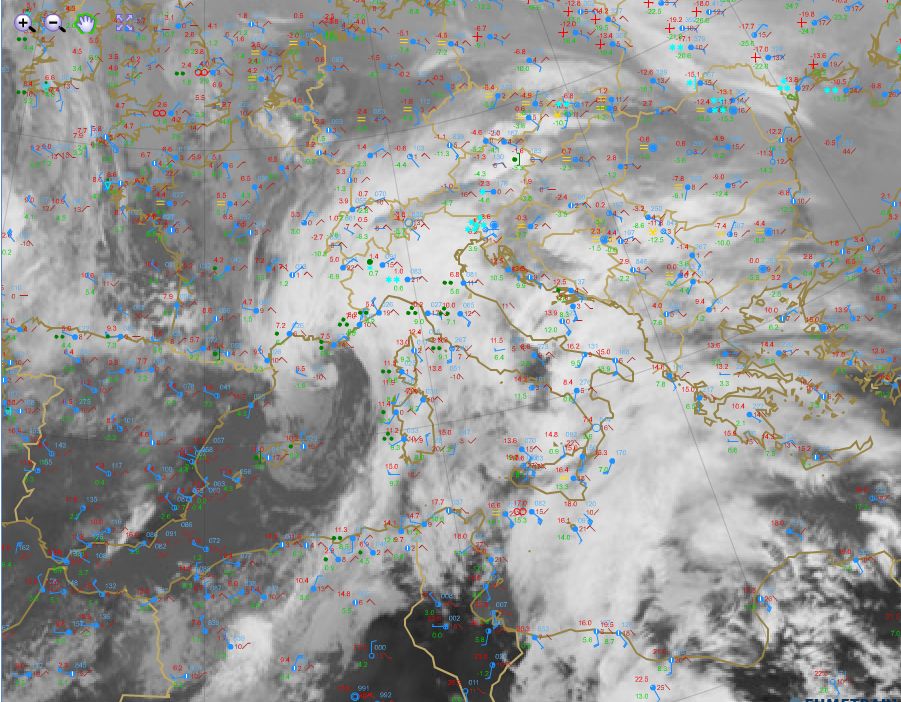
Figure 6: MSG SEVIRI 10.8 µm image and synoptic observations from 30 January 2014, 12 UTC. Click on the image to enlarge it.
The synoptic observations in Figure 6 show heavy rain from Sicily to northern Italy (green dots). In the high mountains of South Tyrol, Slovenia and Austria the precipitation comes as snow (cyan stars).The boundary between rain and snowfall can be identified in the 2 meter temperature chart (Figure 7).
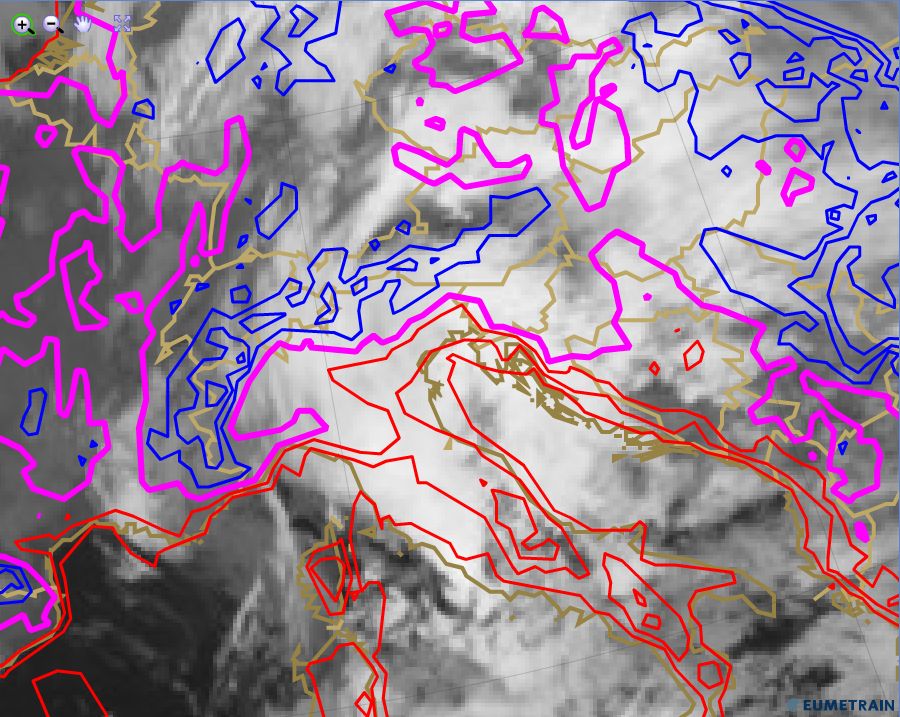
Figure 7: The ECMWF 2 meter zero degree [°C] temperature isoline is depicted in magenta. Red isolines represent positive, blue isolines negative temperatures.
Initial Phase (29 January, 00 UTC - 30 January 12 UTC)
Figure 8: NOAA NESDIS operational blended TPW product loop (29 January 2014, 00 UTC to 30 January 2014, 12 UTC). The sketched red line delineates the southern extent of the trough.
In the initial phase, the operational blended TPW product shows the dry polar air mass (blue) extending from the British Isles far down to Morocco. On the eastern edge of the trough, we can see more humid air in cyan colours propagating towards the north. At this time of the year, the Mediterranean Sea hardly contributes to humidity due to low water temperatures. One may then wonder: where is the source of moist air bringing rain and snowfall to central Europe?
The above TPW product shows an easily identifiable region of moist air of tropical origins at the lower (southern) part of the image. As the cold air trough propagates very far into the south, cyclonic circulation taps into the reservoir of moist tropical air around and near the equatorial regions. The above TPW loop (Figure 8) shows a tongue of tropical air (green) advecting towards the north.
Figure 9: NOAA NESDIS operational TPW anomaly product loop (29 January 2014, 00 UTC to 30 January 2014, 12 UTC). The brown contour line shows the region of high TPW advected to the north.
The above TPW anomaly product loop (Figure 9) shows the cold and dry air propagating towards the south. Along its eastern part, we can identify a moist band with TPW values of about 150% above normal. The plume of tropical air over Africa, advected from the south, is well depicted towards the end of the loop exceeding values of 200% over normal.
Note
The region of moist tropical air identified in the absolute values of TPW (Figure 8) is not seen in the anomaly product (Figure 9) because the region around the equator is typically warm and humid at this time of the year. The TPW climatology used in the anomaly product tends to sweep this information out.
Culmination Phase (30 January, 13 UTC - 1 February, 23 UTC)
Figure 10: NOAA NESDIS operational blended TPW product loop (30 January 2014, 13 UTC to 1 February 2014, 23 UTC). The sketched red line delineates the propagation of moist and warm air towards the north.
From the initial phase on, we can identify a band of moist air along the eastern side of the cold air trough. During the culmination phase, the blended TPW product (Figure 10) shows a concentration of moist warm air (the moisture plume) emanating from the tropics and extending north along the eastern edge of the trough and heading towards Italy. The Mediterranean Sea's total atmospheric moisture (humidity) contribution to the overall moisture plume is much smaller than the one from tropical regions.
Figure 11: NOAA NESDIS operational TPW anomaly product loop (30 January 2014, 13 UTC to 1 February 2014, 23 UTC). The sketched brown contour line delineates the region of high TPW extending to the north.
The TPW anomaly product shows the propagation of moist air as it crosses the Sahara and the Mediterranean (yellow colours in Figure 11). This unusually high amount of TPW reaches the south face of the Alps by 1 February 2014. The advection of total atmospheric moisture is further enhanced by the approach of another cold front caused by a second cold air outbreak over western Europe. This approaching cold front can be tracked in the above loop as a band with unusually high TPW arriving from the west.
Addendum
The high amount of moisture being lifted along the south face of the Alps contributed to the extreme amount of precipitation. Moisture can be transported over long distances without changing its phase. The transition from sea level to elevated land or the forced lifting by orographic barriers may lead water vapour to condense when the air is near its saturation point.
This example shows that low level moisture can be transported over long distances and can be tracked easily by TPW products.
In this example, the rising of warm and moist air masses within the warm front, together with forced lifting by the Alps, led to extreme precipitation in Italy, Slovenia and Austria. Railroad connections were closed for several days and individual transport was difficult if not impossible on some traffic routes. Power lines were cut by trees falling on the lines under the weight of the snow.

Figure 12: hoto of heavy snowfall in the Alps (Credit: L Silvanti, MeteoSvizzera)
Figure 13 shows the 24-hour accumulated precipitation from 06 UTC on 30 January to 06 UTC on 31 January 2014. The highest amounts of precipitation can be found in the tri-border region of Italy, Slovenia and Austria. Note the strong gradient parallel to the mountain crest.
Figure 13: Accumulated Precipitation [mm] over 24 hours (30 January 2014 to 31 January 2014, 06 UTC) by the Nowcasting System INCA.
As a result of the high amount of snowfall in the Alps, the risk of avalanches rose in the following days (Figure 14). Heavy snowfall combined with strong wind often increases the avalanche threat.

Figure 14: Avalanche risk for the region of the Austrian Alps reaching from 1 (low) to 5 (very high) for 31 January 2014.