TPW retrieval from LEO satellites
Sounding instruments on polar orbiting satellites
While the SEVIRI and the future ABI sensor on GEO satellites scan the Earth's atmosphere in the IR range (2 - 13 µm), sounding instruments on polar orbiters use the microwave bands in the range from about 5 - 200 GHz or 0.15 - 6 cm to chart the concentration of water vapour in the atmosphere. Microwaves are not blocked by cloud droplets or ice crystals and penetrate the whole atmosphere from its top to the boundary layer in all weather conditions, day and night. This makes them well suited for observing clouds, precipitation and water vapour.
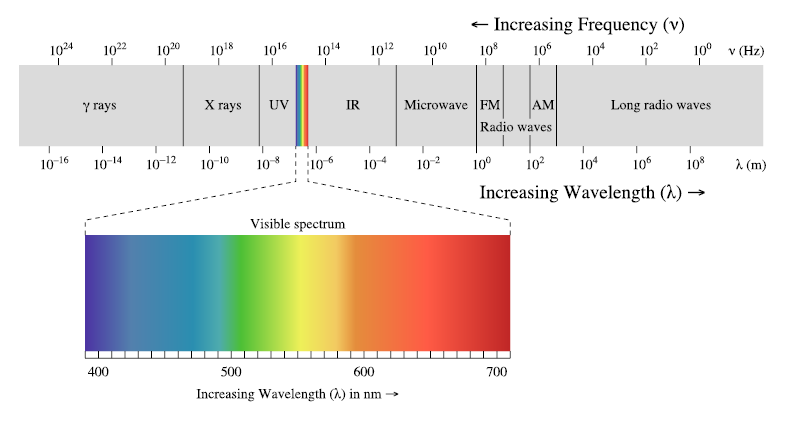
Figure 8: Schematic of the electromagnetic spectrum.
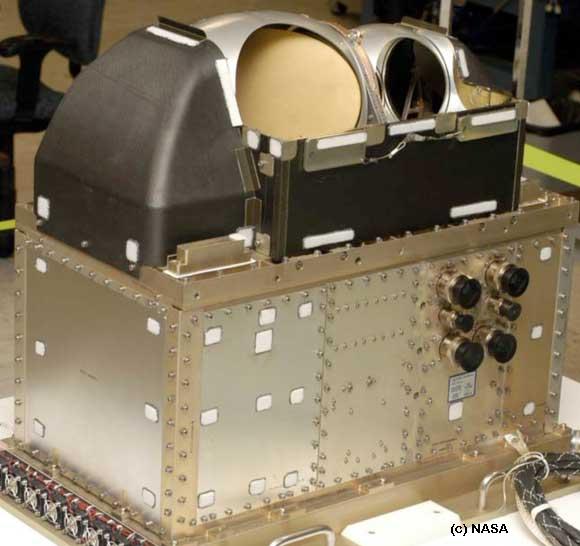
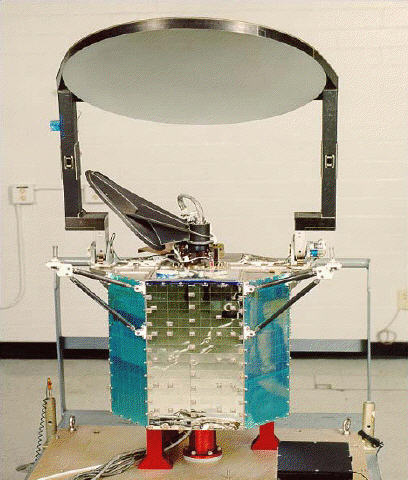
Instruments on polar orbiting satellites like
- the "Advanced Technology Microwave Sounder" (ATMS) on Suomi NPP satellite (see ATMS instrument)
- the "Special Sensor Microwave Imager/Sounder" (SSMI/S) of the DMSP satellites (see SSMIS instrument)
- the Microwave Humidity Sounder (MHS) on MetOp and NOAA satellites (see MHS instrumen)
- the "Advanced Microwave Sounding Unit" (AMSU) on board NOAA and MetOp satellites (see AMSU A1 and A2 instruments)
are passive sensors measuring atmospheric and terrestrial radiation to provide vertical profiles of temperature and humidity. These sounders can provide image-based products too.
Various technical implementations are currently used to augment the instruments' field of view. For example, NOAA and MetOp AMSU/MHS instruments use the linear cross track scanning method. The disadvantage of this method is that the resolution of the AMSU instrument, for example, degrades continuously from 45 km at nadir to 75 km at the edge of the swath.
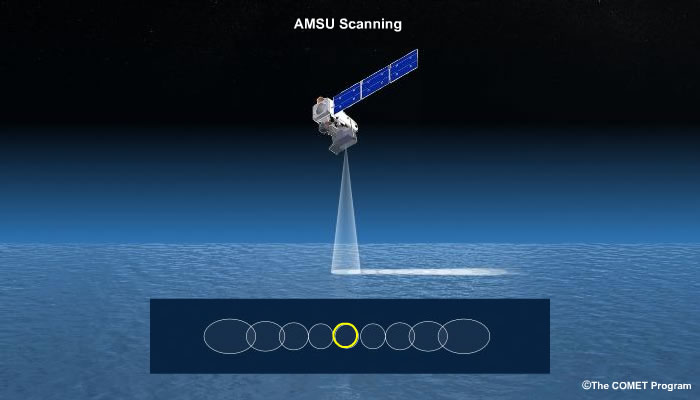
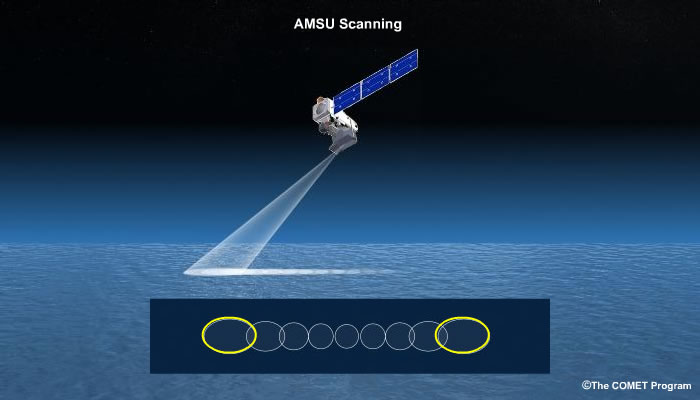
Figure 9: Linear cross track scanning principle. Lower resolution at high scanning angles compared to nadir view. © The COMET Program
The SSMI/S instrument on DMSP satellites employs another scanning strategy. The so-called conical scanning produces narrower scan widths but maintains the resolution across the entire swath.
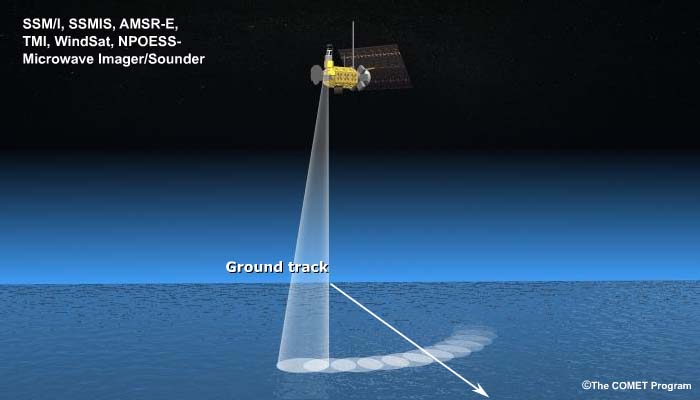
Figure 10: Conical cross track scanning principle ensures constant resolution with constant viewing angle. © The COMET Program.
The Radio Occultation Method
In contrast to the aforementioned microwave sounding instruments, the Radio Occultation (RO) method follows a horizontal (or, more precisely, tangential) sampling strategy. The basic principle of the RO method is that a receiver onboard a low-orbiting satellite tracks GPS (Global Positioning System) signals, as the transmitting satellite sets or rises behind the Earth (Figure 11). Due to refraction in the ionosphere and the neutral atmosphere the GPS signal is delayed and its path bent, enabling calculation of the index of refraction (or refractivity) and subsequently temperature and humidity as a function of height.

Figure 11: The figure shows how radio signals from GPS satellites (left) are bent by the atmosphere and received by the RO instrument (right). Several consecutive measurements result in a vertical profile of humidity and temperature (white line).
The RO method is an indirect measurement of temperature, pressure and water vapour in the atmosphere from vertical profiles of the refractive index. This method provides absolute water vapour content or partial pressure rather than relative humidity. This makes it particularly useful for obtaining a measure for the total water vapour content in a column of the atmosphere integrated from surface to space.
Bending angles are provided for altitudes ranging from 80 km down to the ground. Hence, RO measurements provide vertical information of temperature and humidity of the low, middle and high troposphere (and above). Each RO profile consists of approximately 3000 rays. About 500 vertical profiles are compiled per day and RO instrument.
Profiles are distributed over the globe irregularly, though still providing a good global coverage. RO yields a high vertical resolution of about 100 m while the horizontal resolution is poorer with ~ 200 km. RO paths are only marginally affected by clouds, aerosols or precipitation.
The primary field of application for RO profiles is assimilation into NWP models and climate observations. As they are retrieved with identical accuracy over land and sea, TPW from RO profiles can be used to complement TPW plots from microwave sounding instruments (see next chapter).