Chapter VII: Convective initiation at WV boundaries
Table of Contents
- Chapter VII: Convective initiation at WV boundaries
- Convective initiation
- Example: 28 July 2005
- Summary and quiz
Convective initiation
When studying convective initiation, the focus is often on parameters near the surface (e.g. moisture convergence, convective temperature, lifting condensation level, orography, etc.). Convection, however, can also be triggered higher up. This chapter deals with deep moist convection (DMC) triggered in the upper levels, which can be seen in WV images.
When and where convection initiates in a conditionally unstable atmosphere depends on factors like orography, wind shear, moisture and baroclinity. In this chapter we will focus on the so-called pulse convection, which mostly occurs during the day without frontal zones or distinct convergence or other boundaries near the surface. Pulse convection usually develops within a warm air mass in a situation where there is a weak surface high and an upper ridge above it.
Figure 1 shows such a synoptic situation over Turkey; convective cells are developing near the vicinity of a black WV stripe (figure 1a) while the corresponding HR-VIS image (figure 1b) shows shallow convection over central Turkey but gives no indication where DMC will initiate.
a)  |
b)  |
Figure 1a 1b: WV 6.2?m satellite image from 26 June 2012 at 12:00 UTC (top) and HR-VIS image of the same date (bottom).
Figure 2: WV 6.2 µm satellite loop at 26 June 2012 from 08:00 UTC to 14:00 UTC.
One of the most effective triggers for convection is orography. According to Doswell (1987), DMC requires sufficient available moisture, conditional instability and a source of lift. If enough lifting energy is provided, a rising air parcel might reach the condensation level, leading to strong DMC at the level of free convection. If the lifted parcel starts from a higher surface, such as a mountain slope, less energy is needed to reach the level of free convection.
Less known, but hardly less effective for initiating convection, are moisture boundaries in the atmosphere. These boundaries in the mid-troposphere are easily detected in WV 6.2 µm satellite imagery. The question is, why does convection often initiate at WV boundaries?
Incoming short wave radiation from the sun is not significantly weakened by atmospheric water vapour (atmospheric window). However, water vapor absorbs a large deal of outgoing long-wave radiation, as it is one of the most effective greenhouse gases.
Strong solar radiation leads to a temperature increase on the surface and the air near it, thus increasing the vertical temperature gradient and instability near the surface. Water vapour, on the other hand, leads to a temperature increase in the higher levels due to the absorption of the outgoing long-wave radiation (figure 3).
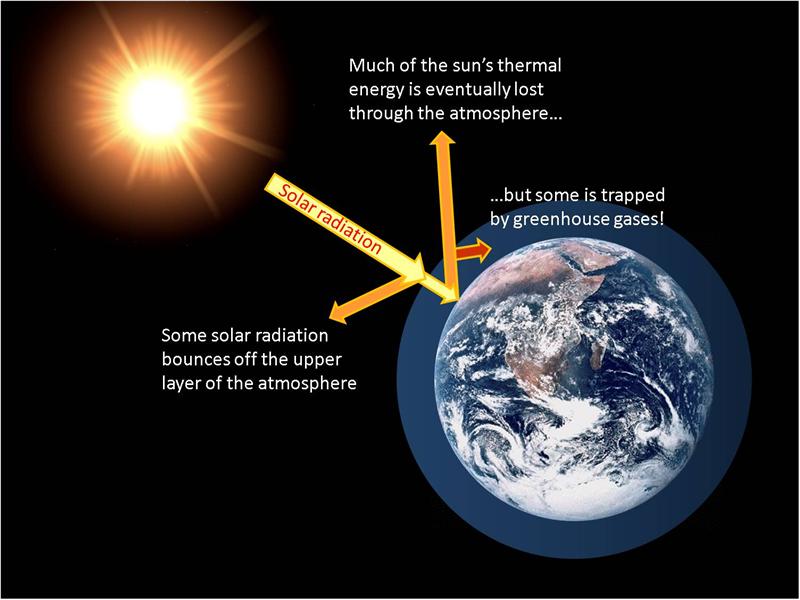
Figure 3: Schematic explaining the greenhouse effect which warms up the Earth's atmosphere (red arrow).
Another mechanism concerning diabatic heating of the troposphere, though not very pronounced, shall be mentioned here. Incoming long-wave solar radiation is also absorbed by atmospheric trace gases like water vapour. According to Liou (2002, p87), long-wave IR radiation from the sun accounts for about 50% of the incoming energy.
Seen this mechanism alone and excluding other processes (e.g. advection), a certain fingerprint regarding the vertical temperature profile and the distribution of WV in the atmosphere can be seen.
The mechanism described above explains why DMC often appears first at WV boundaries. In fact, convection could start at any point where temperature stratification becomes unstable. Indeed, this is often the case, a fact that glider pilots experience during their flights.
The development of DMC requires a source of humidity. If the troposphere contains too much moisture, instability will be slower to develop than in a dry atmosphere, where super-adiabatic temperature gradients will quickly appear near the surface, provided solar irradiation is strong enough.
Within and near WV boundaries, temperature gradients increase rapidly near the surface, but tropospheric moisture absorbs only little long-wave radiation. Consequently, there is enough lift and moisture for convection to initiate and even intensify.
The more moisture there is in the troposphere, the more solar energy is absorbed before reaching the surface. The solar energy absorbed by atmospheric WV tends to reduce potential instability (figure 4).
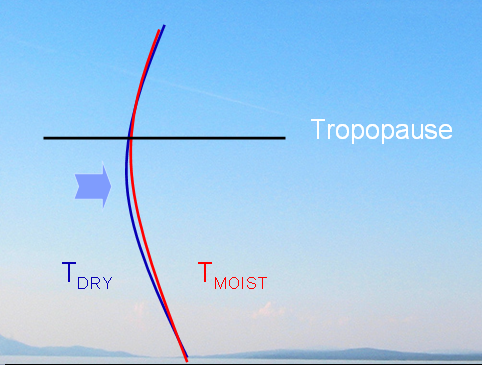
Figure 4: Idealised temperature profiles of a dry compared to a moist troposphere under the presumption of atmospheric heating by greenhouse effect. The vertical temperature distribution is more unstable in the colder, dry air than in the warmer, humid air in the middle and upper troposphere (blue arrow).
Moreover, black stripes usually designate regions with descending dry air from higher atmospheric levels. This dynamic process conteracts the process of DMC by capping ascending air parcels in the form of higher-up inversions. In these regions, more convective energy will be needed for an air parcel to reach the level of free convection.
Example: 28 July 2005: A case of DMC over northern Austria
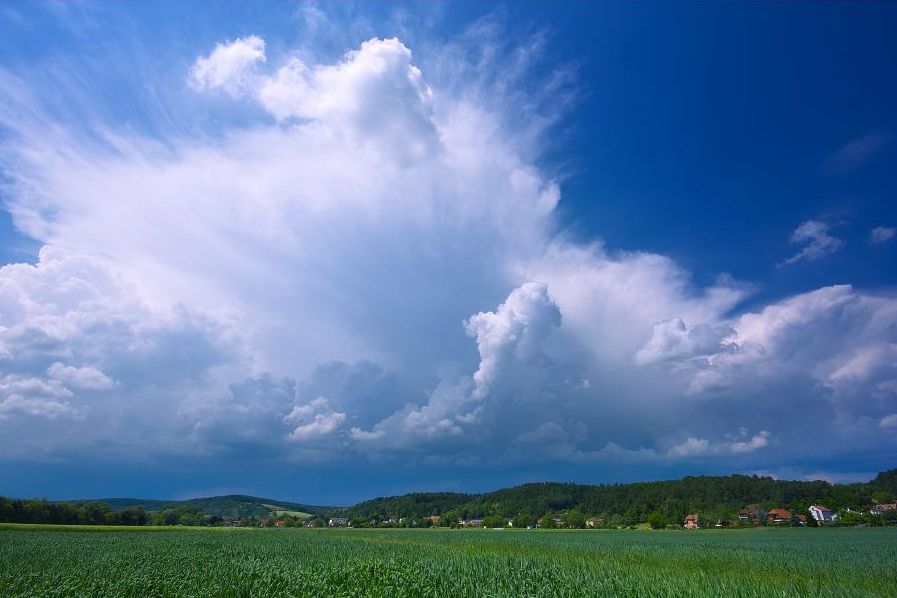
Figure 5: Deep moist convection seen from the ground. Cirrus clouds indicate that convective activity has reached the ice phase.
These synoptic charts from 28 July 2005 show a cold front over Spain and France and a warm front over Germany and the Czech Republic (Figure 6a and 6b). Austria lies within the warm sector.
a)  |
b)  |
Figure 6a and 6b: Reanalysis from NCEP: 500 hPa geopotential (left) and 850 hPa temperature (right).
The 28 July 2005 case is ideal for demonstrating the onset of DMC at a WV boundary. The distinct black stripe extends from Italy to Poland and crosses Austria (figure 7b). There is no significant frontal circulation over central Europe.
a) 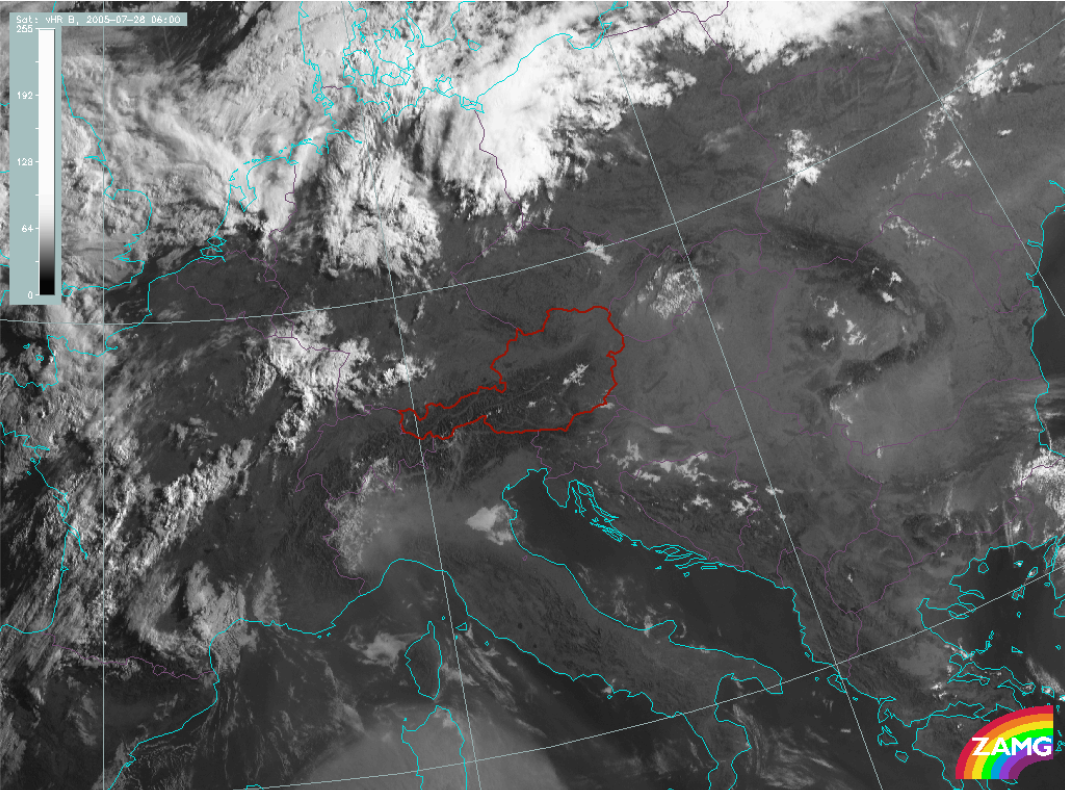 |
b) 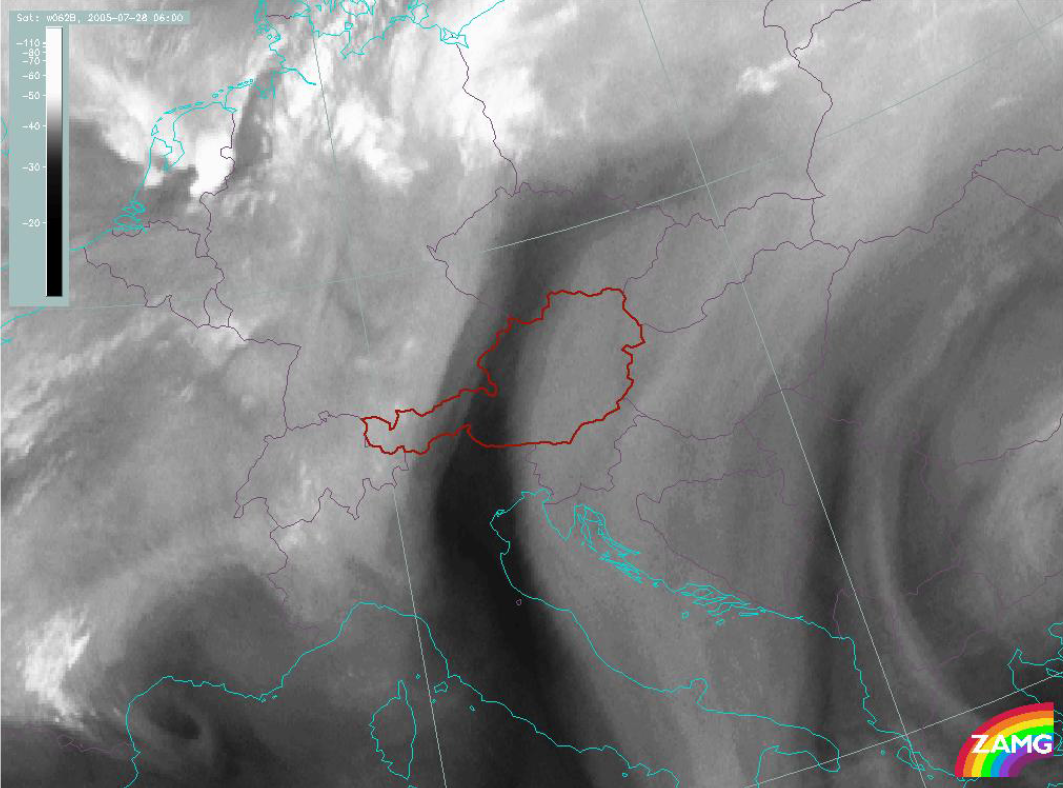 |
Figure 7a and 7b: HR-VIS (left) and WV 6.2 µm satellite image (right) from 28 July 2005, 12:00 UTC.
The HR-VIS image on the left side (figure 7a) makes it possible to detect even shallow convection over the Alps and their surroundings. In the MSG WV 6.2 µm channel, only DMC reaching above the height of 500 hPa appears as bright white spots (figure 8).

Figure 8: WV 6.2 µm satellite image loop from 28 July 2005 from 08:00 to 19:00 UTC.
The WV 6.2 µm loop above depicts the initiation of DMC in the north-eastern parts of Austria, right within the transition zone between moist and dry troposphere. A few hours later DMC starts at the opposite boundary south of the first convective cell. The larger convective cells over France and Germany belong to the frontal zone and are subject to different processes that also initiate convection. The convective cells developing over Romania are mainly triggered by the Carpathian Mountains.
It might be worthwhile to look at NWP fields to get a better insight into the physical processes accompanying convection at WV transition zones. As seen in the previous chapters, WV black stripes often result from descending stratospheric air and exhibit a lower dynamic tropopause. This also limits the vertical extension of convection. Figure 9 depicts the height of the PV=1.5 PVU surface. DMC appears in the crowding zone of the isobars on this surface.
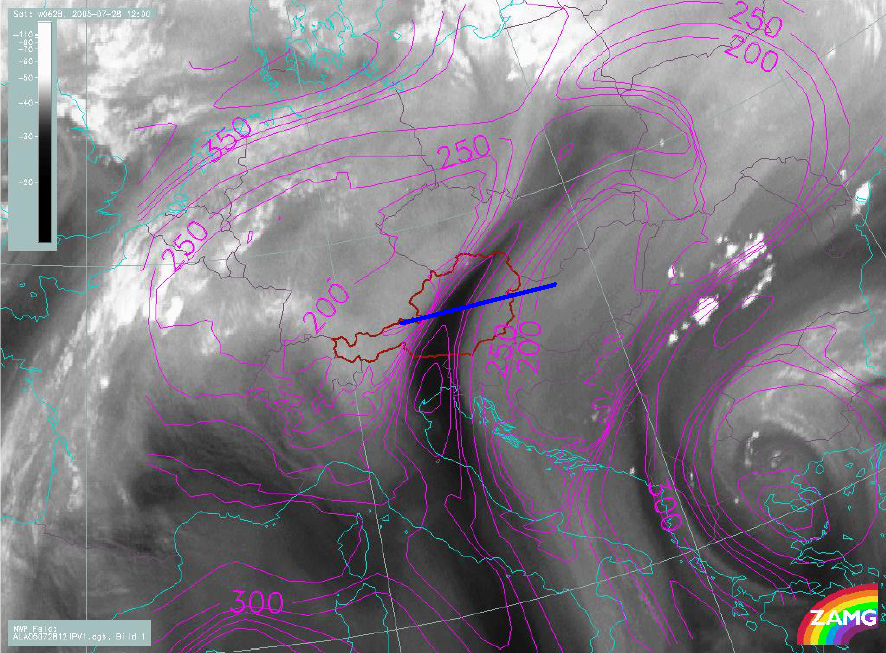
Figure 9: MSG WV 6.2 µm satellite image with PV=1.5 PVU surface from the ALADIN model. The blue line indicates the position of the vertical cross section in figure 13.
The vertical cross section shown in figure 10 shows the PV=1.5 PVU surface reaching down to 300 hPa in the area of the black stripe.
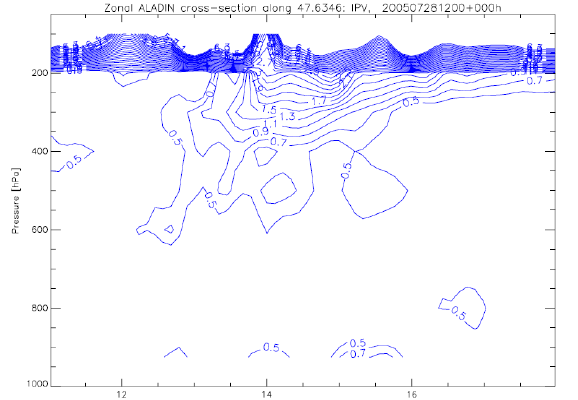
Figure 10: 28 July 2005, 12:00 UTC, ALADIN zonal vertical cross section. Positive values of potential vorticity: solid blue lines. Values of PV=1.5 PV units at a level of about 300 hPa indicate the dry intrusion of the WV dark stripe.
The ALADIN humidity field at 300 hPa reflects the dry zone in the WV 6.2 µm satellite image (figure 11). Relative humidity of 10% coincides with the dark stripe.
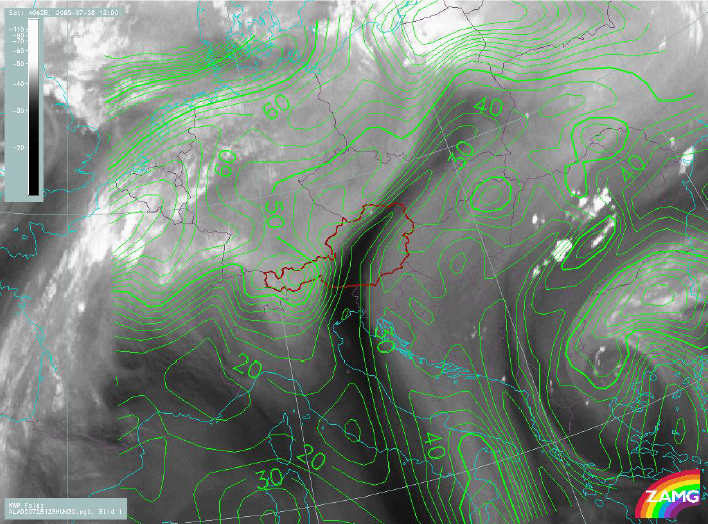
Figure 11: MSG WV 6.2 µm, 28 July 2005, 12:00 UTC, relative humidity at 300 hPa.
Summary and quiz
The atmospheric process mentioned above accounts for many cases where DMC initiates near tropospheric moisture gradients visible in WV 6.2 µm satellite imagery. DMC will not occur in a dry troposphere, where moisture supply is missing. Dark stripes in WV images are often an indication of sinking air masses and hence they put a cap on convection.
Vice versa, when tropospheric moisture content is too high, the long-wave IR radiation heats up the troposphere and constrains convection. Less solar energy reaches the ground. At WV boundaries, the required ingredients for an early onset of DMC are present.
Question
Which of the following factors are necessary for convective initiation at WV boundaries?
The correct answers are a), c) and f).