Chapter III: Cyclogenesis in WV imagery - Baroclinic Leaf
Table of Contents
- Chapter III: Cyclogenesis in WV imagery - Baroclinic Leaf
- Baroclinic Leaf
- The formation of a baroclinic leaf
- Leaf variations
- Baroclinic Leaf 15/16 October 2012
- Exercises
Baroclinic Leaf
Baroclinic leaves are cloud or moisture patterns that can be found on the front sides of high level troughs, most often located downstream of PV anomalies. They are associated with surface baroclinic zones or cold fronts. A baroclinic leaf of this kind can be the first phase of a baroclinic disturbance and is therefore often described as a pre-cyclogenetic cloud band. Cyclogenesis occurs with 75% of baroclinic leaves.
The features of baroclinic leaves can be seen in VIS, IR and WV images. The advantage of using WV channels for observing baroclinic leaves is the possibility to detect early stages of development. This can be seen best when comparing a VIS image of a baroclinic leaf with a WV image (figure 1a and 1b).
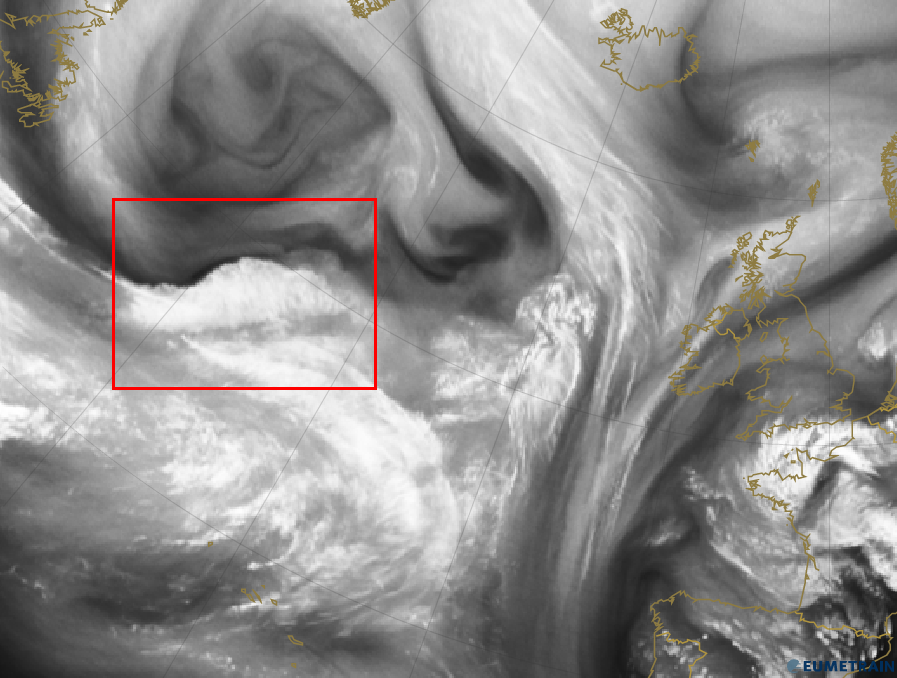
Figure 1a: WV 6.2 µm image from 20 May 2012, 12:00 UTC a baroclinic leaf (red square) develops over the Atlantic.
The formation of a baroclinic leaf
A baroclinic leaf begins with the undulation of an air mass boundary. This process can be best observed in water vapour images because they show as a tell-tale black stripe. During the development process, the leaf takes on a typical s-shaped moisture pattern in WV imagery, with a concave and a convex part (figure 1a). In the majority of cases, the convex part of the leaf structure is well defined in the beginning, but may become less distinct with further development. In WV images, a dark zone that narrows over time can often be seen at the poleward edge of the concave part. A dark spot corresponding to a dynamic tropopause anomaly can also be seen in this part. Even though its shape changes, this feature will remain prominent throughout the leaf structure's development.
The formation of a baroclinic leaf typically occurs together with significant PV anomalies on the 1.5 PVU surface. Moreover, the leaf's type is determined by its position relative to the jet stream.
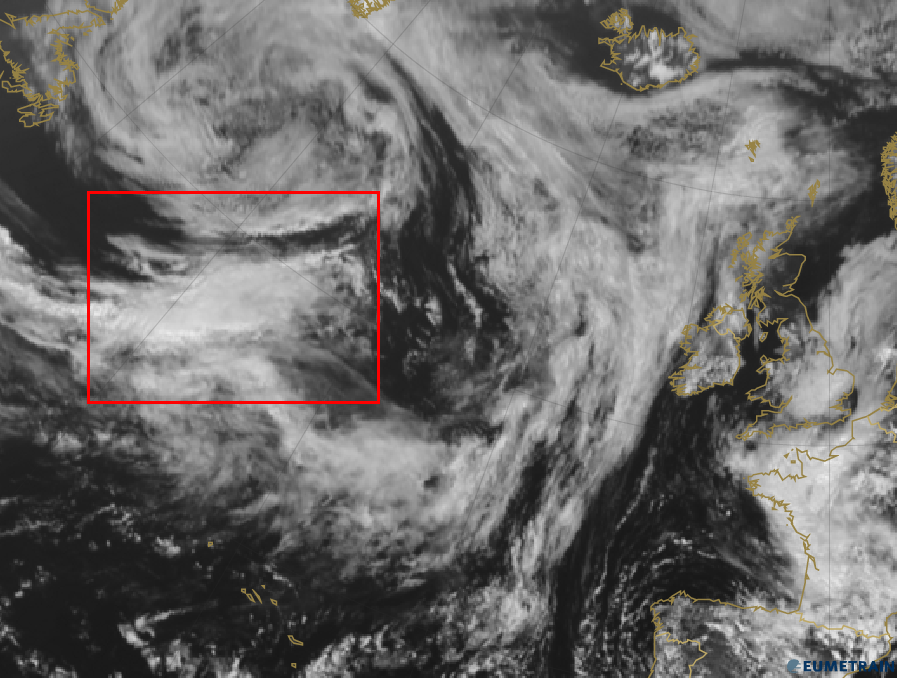
Figure 1b: VIS image from 20 May 2012, 12:00 UTC the development of the baroclinic leaf (red square) is not as pronounced as in the WV image.
Leaf variations
A baroclinic leaf's appearance can vary depending on how the upper level trough and jet streak are positioned. Two main types of leaves can be distinguished: the first type is connected to a trough and a continuous jet stream, while the second type is heavily influenced by an approaching jet.
The type that forms on the leading edge of an upper level trough is more common. They move parallel or slightly to the right of the jet (towards the warmer air mass). A schematic of this leaf type is presented in figure 2a.
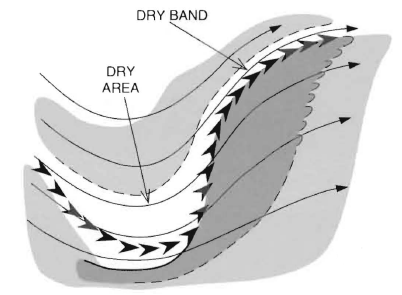
Figure 2a: Baroclinic leaf on the front side of a trough (common type). The jet axis is shown by a line of arrows. Note that in these schematics dry (white) and humid (black) areas are inverted compared to the usual depiction.
At least in the early stage, the leaf has an s-shaped rear edge with a distinct concave part in WV imagery. The jet axis (black arrow line in figure 2a) lies along the convex part but not fully along the concave sector. The rear edge of the concave part is adjacent to the driest areas in WV images.
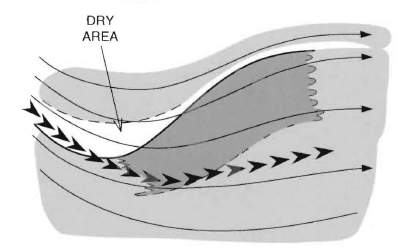
Figure 2b: Baroclinic leaf on the poleward side of a jet axis
The second leaf type can be seen in figure 2b. In this type the jet crosses the leaf so that it is left on the cold side of the jet (black arrow line in figure 2b) and lies on the poleward side of the jet axis. This baroclinic leaf also shows an s-shaped appearance with a relatively indistinct convex part in WV imagery.
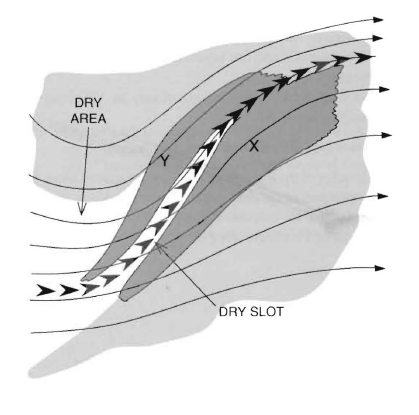
Figure 2c: "Double leaf"
Notice:
| In general, baroclinic leaves developing within the main polar front are larger than those that form within secondary baroclinic zones in the cold air. |
Baroclinic leaf 15/16 October 2012
A cyclogenetic process featuring a baroclinic leaf took place over the Atlantic Ocean west of Ireland, starting on 15 October 2012. The development of the leaf begins with a cloud moisture pattern on the front side of a shallow trough at around 18:00 UTC, as can be seen in figure 3a (WV 6.2µm satellite image, black arrow). The baroclinic leaf develops within a baroclinic zone (figure 3b), although there is no distinct frontal cloud band yet. Comparing the position of the jet to that of the leaf reveals that the jet maximum is located upstream of the leaf, and that the jet is digging into the cloud band from behind, as anticipated. In figure 3d, the leaf structure is in the vicinity of a significant PV anomaly, which corresponds to the dark stripe in the WV image and to the minimum height of the dynamic tropopause.
No surface low can be detected at this stage of development. The baroclinic leaf can be described as pre-cyclogenetic cloud pattern.
a)  |
b)  |
c)  |
d)  |
Figure 3a - 3d: WV 6.2 µm satellite image from 15 October 2012, 18:00 UTC.
a) WV 6.2 µm image and ECMWF 500 hPa geopotential height (green)
b) WV 6.2 µm image and ECMWF equivalent thickness (green)
c) WV 6.2 µm image and ECMWF isotachs 300hPa (yellow)
d) WV 6.2 µm image and ECMWF height of isentropes with PV=1.5 PVU (pink)
Six hours later, at 00:00 UTC on 16 October 2012, the baroclinic leaf is developing further; the leaf now has a convex and a concave part. The cloud pattern has grown and looks much more organized.
Now that the leaf seems more mature, its type can be determined (see section “leaf variations”). Out of the three leaf types, this one is the closest match to "type B", as the leaf has formed on the poleward side of the jet and ahead of the jet streak (figure 4a). The main jet stream crosses the southern part of the leaf (green line); a secondary jet streak has developed over the northern part (brown arrow).
Another characteristic of this leaf type is the s-shaped rear edge, and that the concave and convex parts are approximately equal in length. Also, the jet axis crosses the concave part of the leaf.
In figure 4b the cold/warm advection dipole over the expanding baroclinic leaf can be seen, showing the ongoing cyclogenetic development. As depicted in figure 4c a small surface low has already formed.
The Air Mass RGB in figure 4d shows not only the cloud structure of the baroclinic leaf, but also the dark red stripe (sign of a PV anomaly) that follows the jet stream and runs over the concave portion of the leaf.
a)  |
b)  |
c)  |
d)  |
Figure 4a - 4d: WV 6.2 µm and Air Mass satellite image from 16th October 2012, 00:00 UTC.
a) WV 6.2 µm image and ECMWF Isotachs 300hPa (yellow)
b) WV 6.2 µm image and ECMWF thermal advection at 700hPa (warm: red, cold: blue)
c) WV 6.2 µm image and ECMWF mean sea level pressure (black) + height of isentropes with PV=1.5 PVU (pink)
d) Air Mass RGB
By 06:00 UTC on 16 October 2012 the leaf had evolved into a comma as the structure developed a definite cusp (figure 5a). Taking a closer look at the comma pattern, it seems that the cloud head developed first, signifying a mid-level cloud extrusion from beneath the cold cloud shield. The temperature advection field (figure 5b) still shows the warm and cold advections. From the PV=1.5 PVU height (figure 5c) it can be seen that the development is ongoing and not yet completed, as the PV minimum only now starts to interact with the surface low. In figure 3d (15 Oct 18 UTC) and figure 4c (16 Oct 00 UTC) the PV maximum related to the jet axis is more or less a straight line. As the cyclogenetic process continues, surface and upper level circulations begin to interact and the PV anomaly approaches the low pressure center. As can be seen in figure 5c, this process has only just started. When the dark stripe (the PV maximum) is above the low pressure center, the cyclogenesis has reached its mature stage.
a)  |
b)  |
c)  |
d)  |
Figure 5a - 5d: WV 6.2 µm and Air Mass satellite image from 16th October 2012, 06:00 UTC.
a) WV 6.2 µm overlaid with ECMWF Mean Sea Level Pressure (black)
b) WV 6.2 µm overlaid with ECMWF Thermal advection in 700hPa (warm: red, cold: blue)
c) WV 6.2 µm overlaid with ECMWF Height of Isentropes with PV=1.5 PVU (pink)
d) Air Mass RGB
Another six hours later (12:00 UTC), the comma has transformed into a vortex and the surface low has deepened from 1000 hPa to 985 hPa within twelve hours (figure 46). A closer look at the Air Mass RGB (figure 6b) shows that there is still potential for further development as the red stripe indicating a tropopause folding is still present. This tropopause folding is also visible in the VCS which runs from the occlusion southeastwardly to Northern Africa (the blue line in figure 6c). This VCS is shown in figure 6d. The potential vorticity minimum between 50°N and 46°N corresponds to the dark red stripe in the Air Mass RGB.
a)  |
b)  |
c)  |
d)  |
Figure 6a - 6d: WV 6.2 µm and Air Mass satellite image from 16 October 2012, 12:00 UTC.
a) WV 6.2 µm image and ECMWF mean sea level pressure (black)
b) Air Mass RGB
c) WV 6.2 µm image and ECMWF PV=1.5 PVU. Position of the vertical cross section (blue line)
d) Vertical cross section extending from 50°N 20°W to 30°N 0°W showing the isentropes (black) and the potential vorticity (pink)
Exercises
Question
What it the right chronological order for stages of diveloping depression?
The correct answer is b).
Question
A baroclinic leaf can be the starting point of
mesocyclone /
cyclogenesis /
cyclolysis /
tornado.
It mainly develops on the forward side of a
ridge /
trough /
baroclinic zone /
deformation zone.
Various leaf types can be distinguished according to the position of the ridge /
ITCZ /
polar front /
jet .