Example: 29 December 2012, 06:00 UTC
On December 29 2012, two deformation zones can be observed in WV images over Europe. These deformation zones are not visible in IR imagery, but can be clearly seen in the WV loop.
Question
Find the two deformation zones in the WV6.2 satellite image by clicking in the selected region. Have a look at the WV-loop
(figure 5).
- Solution: Click here to see these zones.
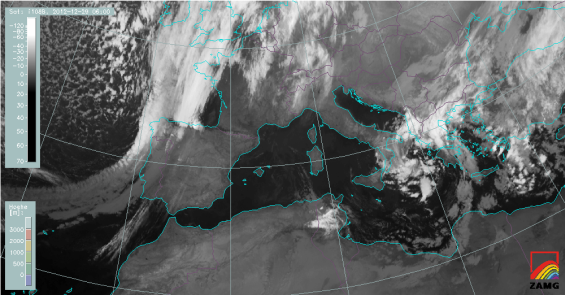
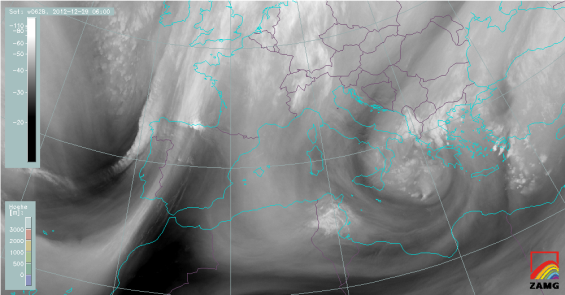
Figure 4: The frontal cloud band extending from Portugal/Spain towards the coast of Morocco is hardly visible in the IR 10.8 µm image. WV 6.2 µm shows a humid zone delimiting an air mass boundary.
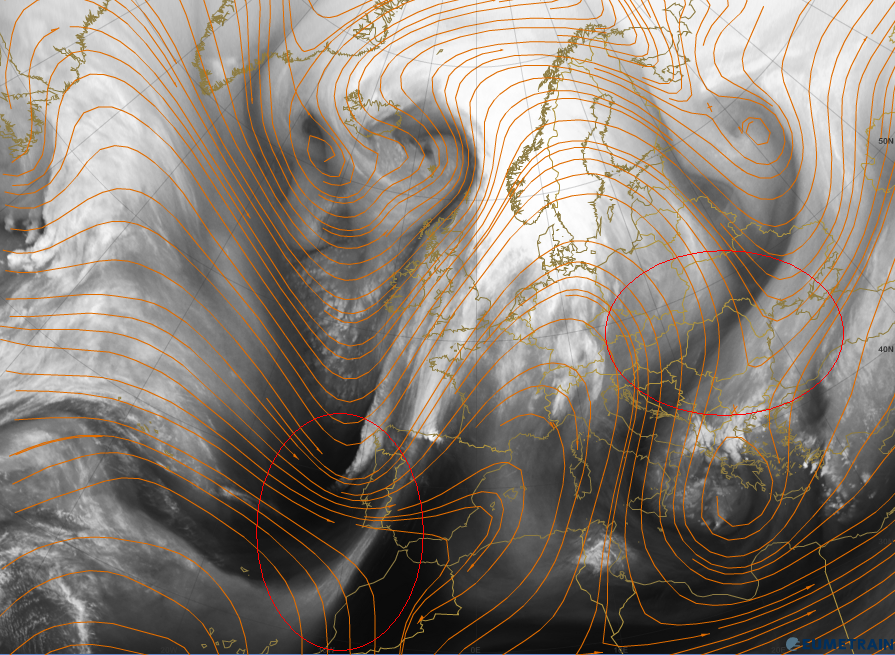
Figure 5: This 12-hour loop of the WV 6.2 µm channel gives a clear indication of the location of the deformation zones.
To better understand the underlying physical processes, we will discuss vertical cross sections (VCS) of the frontal cloud band west of the Moroccan coast. While the deformation zone over southeast Europe is a transition zone between a warm front and an occlusion, as shown in the first example (figure 2), the deformation zone next to Gibraltar has a different origin.
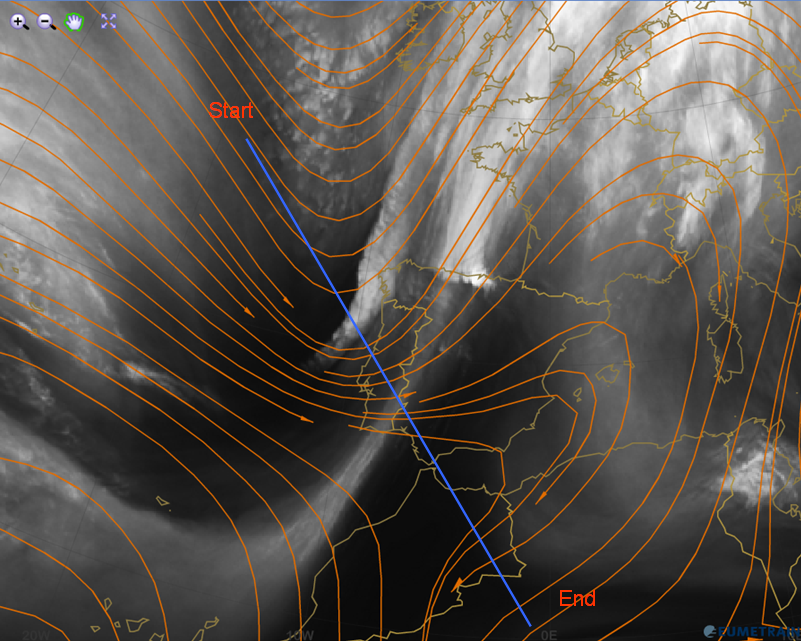
Figure 6: WV 6.2 µm image from 29 December 2012, 06:00 UTC. The blue line marks the location of the selected VCS (Atlantic Algeria).
a) 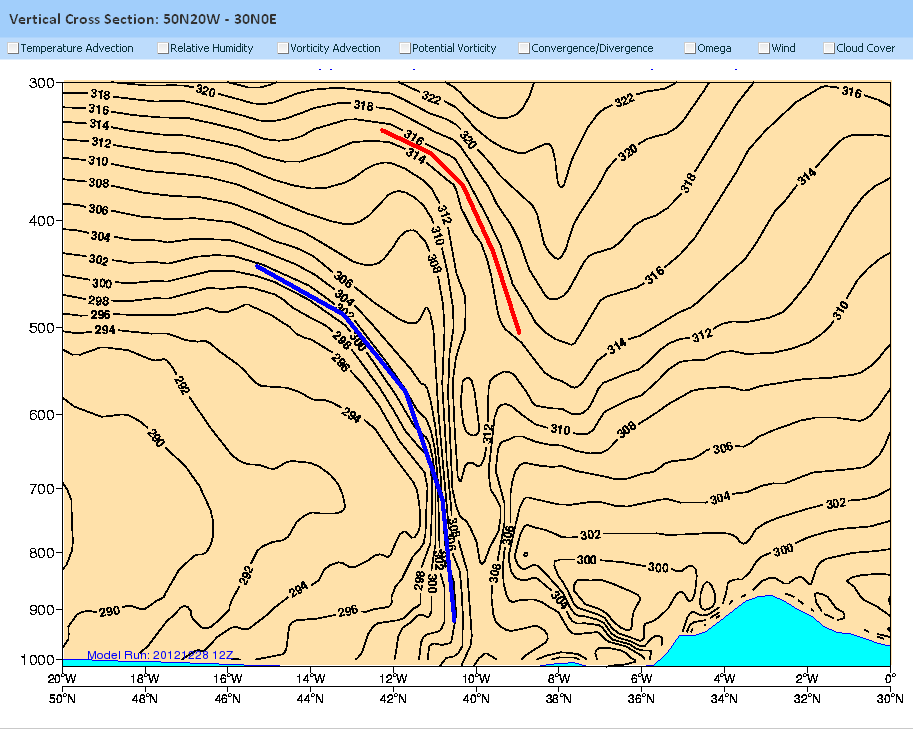 |
b) 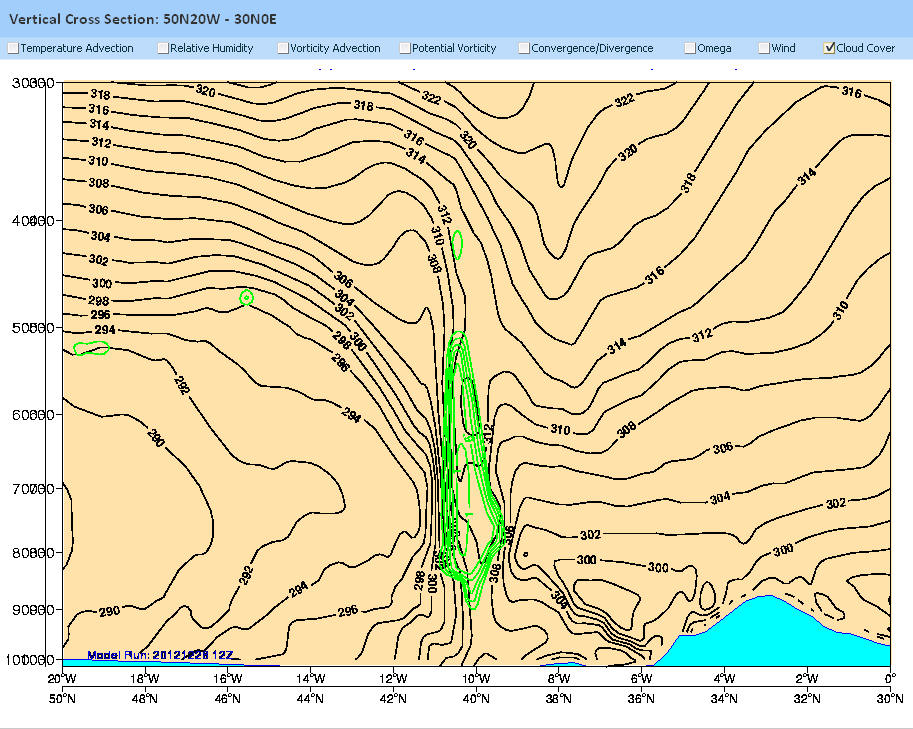 |
c) 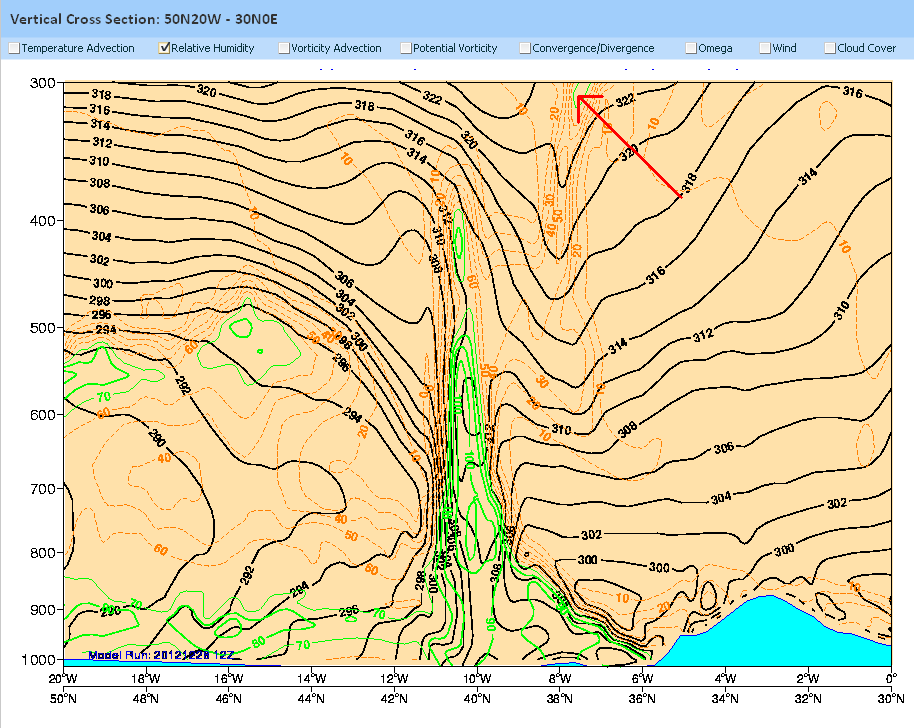 |
d) 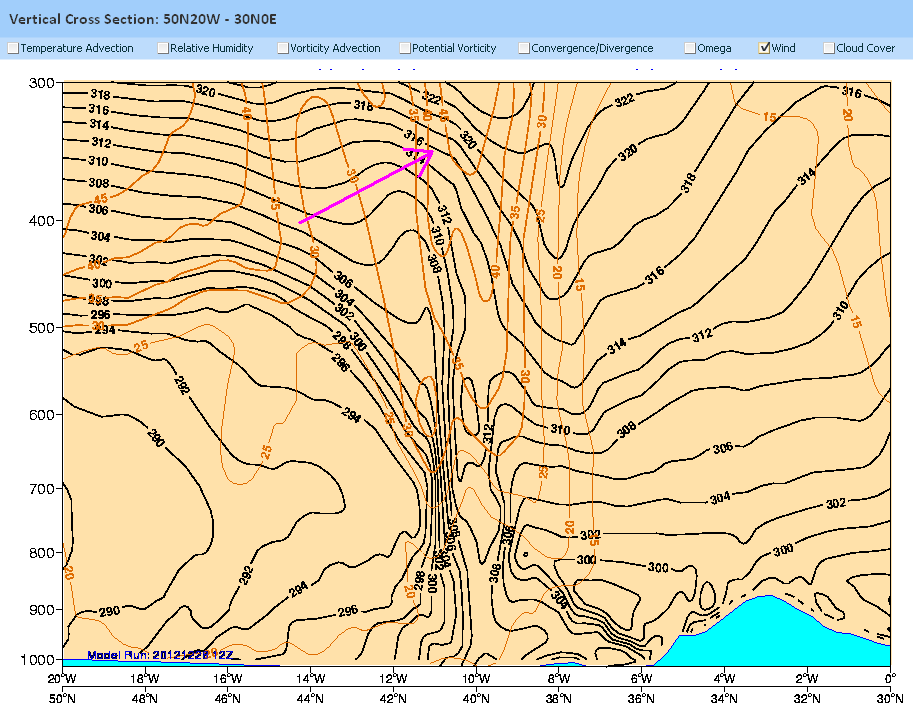 |
Figure 7a-7d: Vertical cross section of the deformation zone. Description of the parameters is given below.
Figure a) shows the isolines of the equivalent potential temperature. A steep cold front reaches from 400 hPa down to the surface (41N and 11W). The cold front (blue line) is moving in an easterly direction. An upper level cold front (red line) can be seen ahead of the cold front and above 500 hPa.
Figure b) shows the cloud cover (green lines) as additional NWP field. Cloud cover extends from 900 to 500 hPa and is clearly part of the cold front. These clouds are visible in the IR image (figure 4), while the upper level cold front is cloud-free.
Figure c) shows the field of relative humidity. Here, we can see a secondary maximum of the relative humidity field associated to the upper level cold front (red arrow). This maximum of the upper tropospheric humidity can be seen as a narrow grey band in the WV imagery (figure 6).
Figure d) shows the isotachs. The wind speed maximum (jet streak) is around 300 hPa (40N and 10W). Strong wind shear (green arrow) can be seen in the area of the upper level cold front, east of the jet streak.
The example above demonstrates that dynamic processes in the upper troposphere might be seen clearly in WV imagery, while they are invisible for IR and VIS channels.