Black stripes and tropopause folding
Dark stripes in WV imagery are a sign of ongoing dynamical processes in the troposphere. These processes can be the formation of new cyclones (e.g. rapid cyclogenesis, an upper level low or frontal waves) or the propagation of frontal zones.
Frontal zones mark the transition from warmer (moist, high tropopause) to colder (dry, low tropopause) air masses or vice versa. Sharp boundaries in WV images indicate a transition from dry to moist air masses, and they are areas with strong gradients in the height of the PV=1.5 PVU surface. These strong gradients of height changes are called tropopause folds (see figure 5).
Notice:
| Tropopause folds can be best observed in WV images, since the lower dynamic tropopause goes hand in hand with sinking dry stratospheric air, which is easily detected in WV channels. |
a) 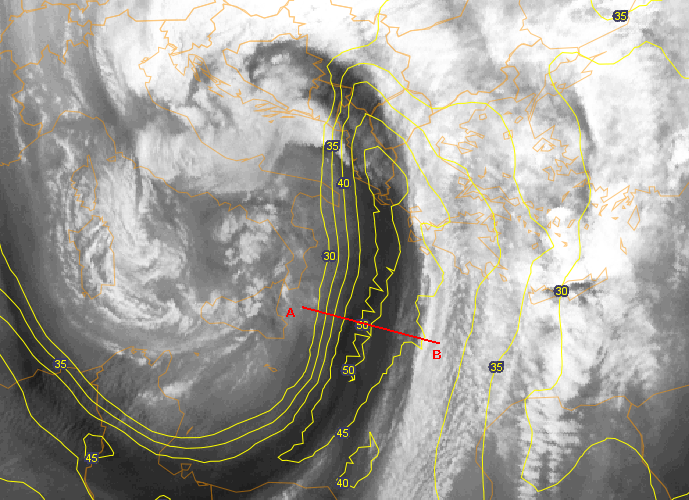 |
b) 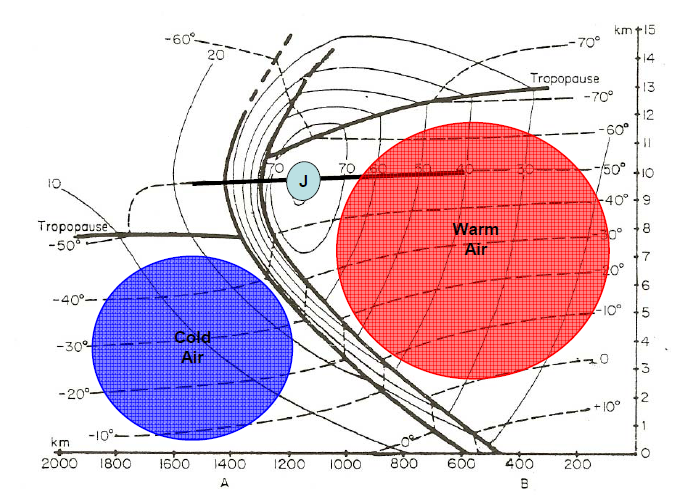 |
Figure 5a and 5b: The left image shows the approximate position of the vertical cross section and the isolines of the jet on the WV 6.2 µm image. The right image shows a vertical cross section (from Christopher T. Kuhl, 2006) with the lower tropopause on the cold side of the front, the higher tropopause on the warm side and the tropopause fold in between.
Tropopause folds connected to air mass boundaries are prone to dynamical turbulence. Turbulence is caused by the change from laminar to disturbed flow. Eddies are generated in the flow which receive the energy from the background current. The energy cascades from the macro scale current to smaller and smaller eddies or physical scales.
The reasons behind an atmospheric stream becoming turbulent are manifold, reaching from thermal instability and orography to strong wind shear.
A closer look at areas with tropopause folds reveals two factors facilitating the generation of turbulent flows: strong vertical wind shear caused by the jet streak and unstable stratified air masses due to the propagating air mass boundary.
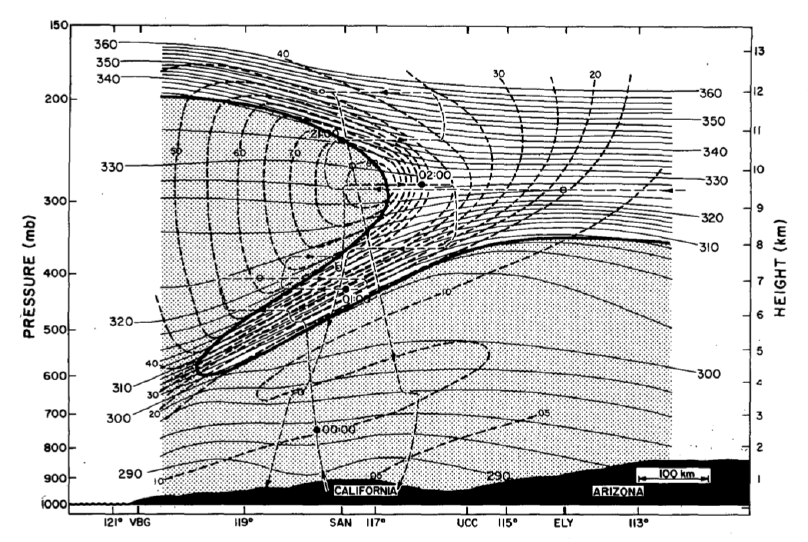
Figure 6: Schematic of a tropopause fold with warm air on the left side and cold air on the right side. Potential temperature depicted in black lines, isotachs in dashed lines. (Shapiro, 1980)
When tropopause folding occurs, a tongue of dry stratospheric air propagates into the air mass boundary underneath the core of the jet stream by ageostrophic forcing (figure 6). This tongue of stratospheric air is delineated by a clear gradient in potential vorticity at its boundaries.
While the wind shear remains strong in the vicinity of the jet streak, the intruding stratospheric air is thermally stable. This is not the case at the upper and lower limit of the dry intrusion. There, thermal instability and strong vertical wind shear favour the occurrence of turbulence (figure 7).
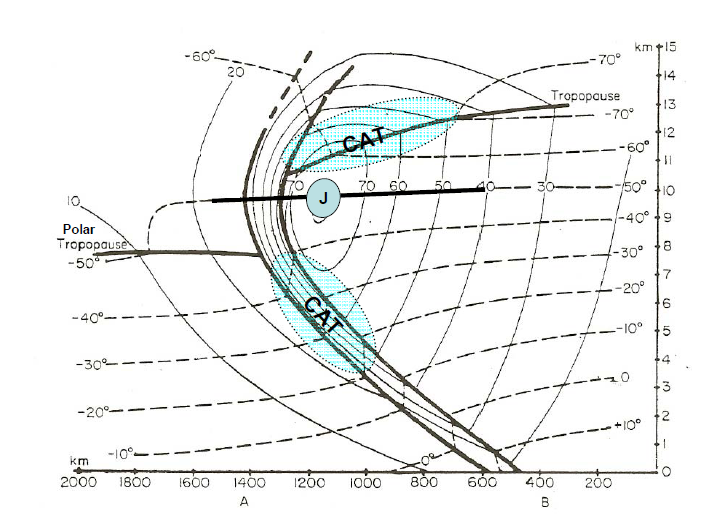
Figure 7: Vertical cross section through a cold front showing the areas prone to turbulence in the vicinity of the jet axis (from Chr. T. Kuhl, 2006).
Hence, the presence of a jet streak (a black stripe in WV imagery) indicates a dry stratospheric intrusion located along an air mass boundary, and they are good indicators of areas prone to turbulence. The exact vertical positions of turbulent areas near tropopause foldings become visible in cross sections depicting the location of the entire tongue of stratospheric air (figure 8).
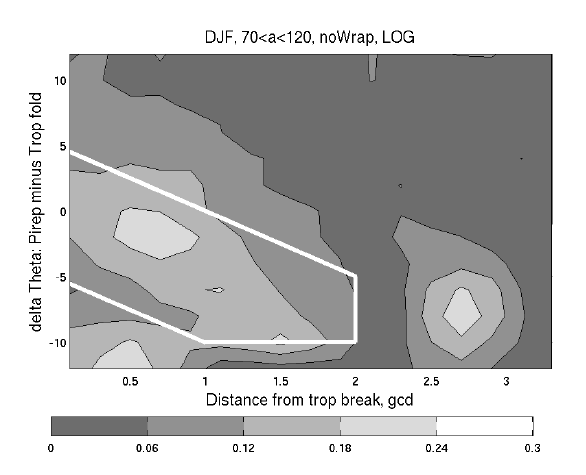
Figure 8: Frequency of light or greater turbulence from eddy dissipation reports near tropopause folds (Dec. 2004 to Feb. 2005) from Wimmers and Feltz, 2010.(1 gcd ~ 111 km). The tongue of stratospheric air is depicted by the white line.