Baroclinic leaf 15/16 October 2012
A cyclogenetic process featuring a baroclinic leaf took place over the Atlantic Ocean west of Ireland, starting on 15 October 2012. The development of the leaf begins with a cloud moisture pattern on the front side of a shallow trough at around 18:00 UTC, as can be seen in figure 3a (WV 6.2µm satellite image, black arrow). The baroclinic leaf develops within a baroclinic zone (figure 3b), although there is no distinct frontal cloud band yet. Comparing the position of the jet to that of the leaf reveals that the jet maximum is located upstream of the leaf, and that the jet is digging into the cloud band from behind, as anticipated. In figure 3d, the leaf structure is in the vicinity of a significant PV anomaly, which corresponds to the dark stripe in the WV image and to the minimum height of the dynamic tropopause.
No surface low can be detected at this stage of development. The baroclinic leaf can be described as pre-cyclogenetic cloud pattern.
a) 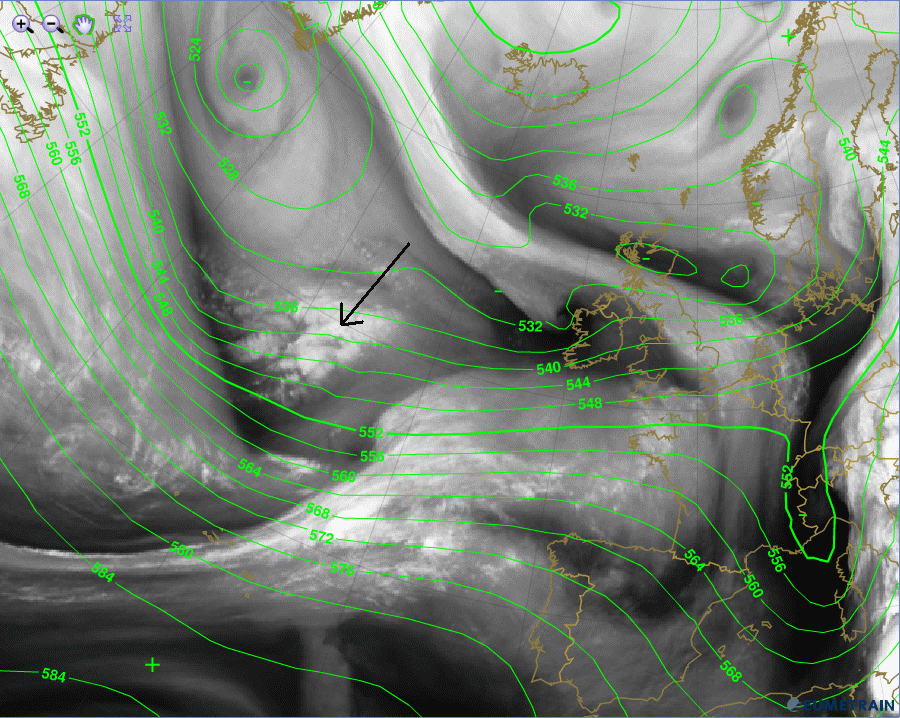 |
b) 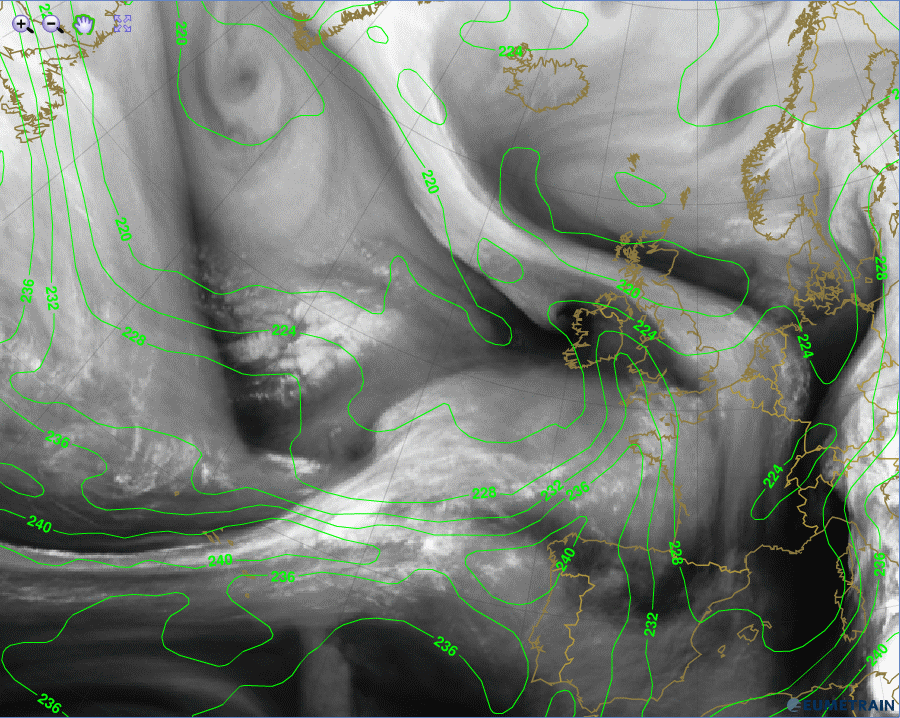 |
c) 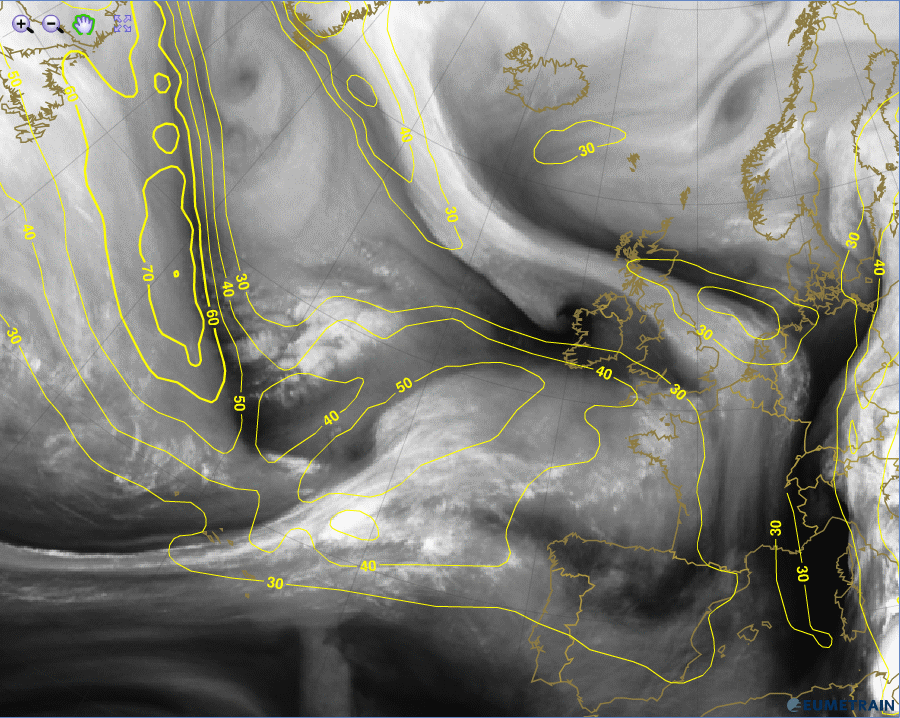 |
d) 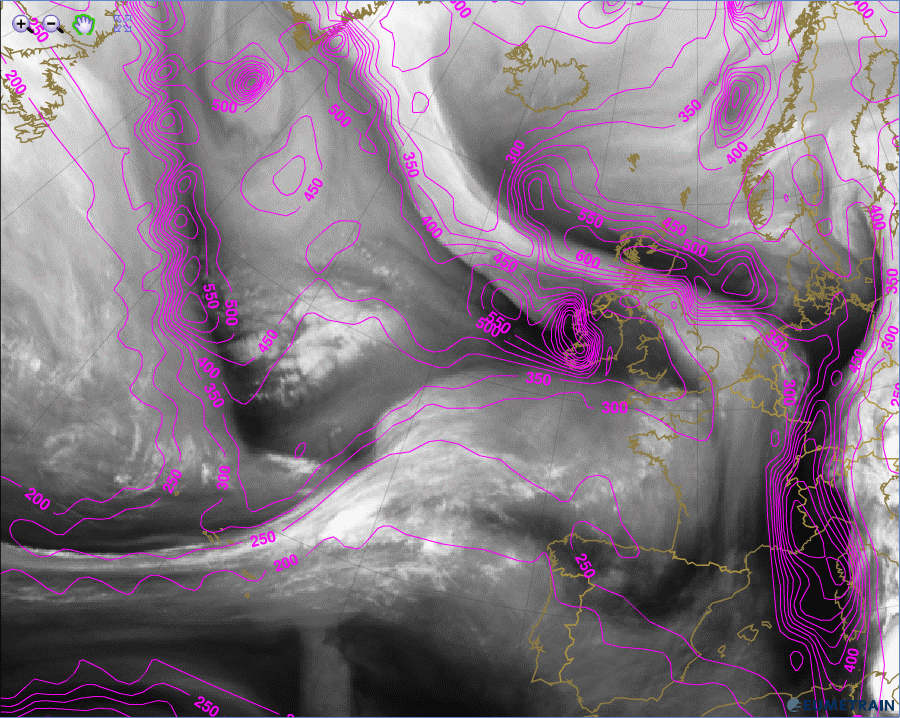 |
Figure 3a - 3d: WV 6.2 µm satellite image from 15 October 2012, 18:00 UTC.
a) WV 6.2 µm image and ECMWF 500 hPa geopotential height (green)
b) WV 6.2 µm image and ECMWF equivalent thickness (green)
c) WV 6.2 µm image and ECMWF isotachs 300hPa (yellow)
d) WV 6.2 µm image and ECMWF height of isentropes with PV=1.5 PVU (pink)
Six hours later, at 00:00 UTC on 16 October 2012, the baroclinic leaf is developing further; the leaf now has a convex and a concave part. The cloud pattern has grown and looks much more organized.
Now that the leaf seems more mature, its type can be determined (see section “leaf variations”). Out of the three leaf types, this one is the closest match to "type B", as the leaf has formed on the poleward side of the jet and ahead of the jet streak (figure 4a). The main jet stream crosses the southern part of the leaf (green line); a secondary jet streak has developed over the northern part (brown arrow).
Another characteristic of this leaf type is the s-shaped rear edge, and that the concave and convex parts are approximately equal in length. Also, the jet axis crosses the concave part of the leaf.
In figure 4b the cold/warm advection dipole over the expanding baroclinic leaf can be seen, showing the ongoing cyclogenetic development. As depicted in figure 4c a small surface low has already formed.
The Air Mass RGB in figure 4d shows not only the cloud structure of the baroclinic leaf, but also the dark red stripe (sign of a PV anomaly) that follows the jet stream and runs over the concave portion of the leaf.
a) 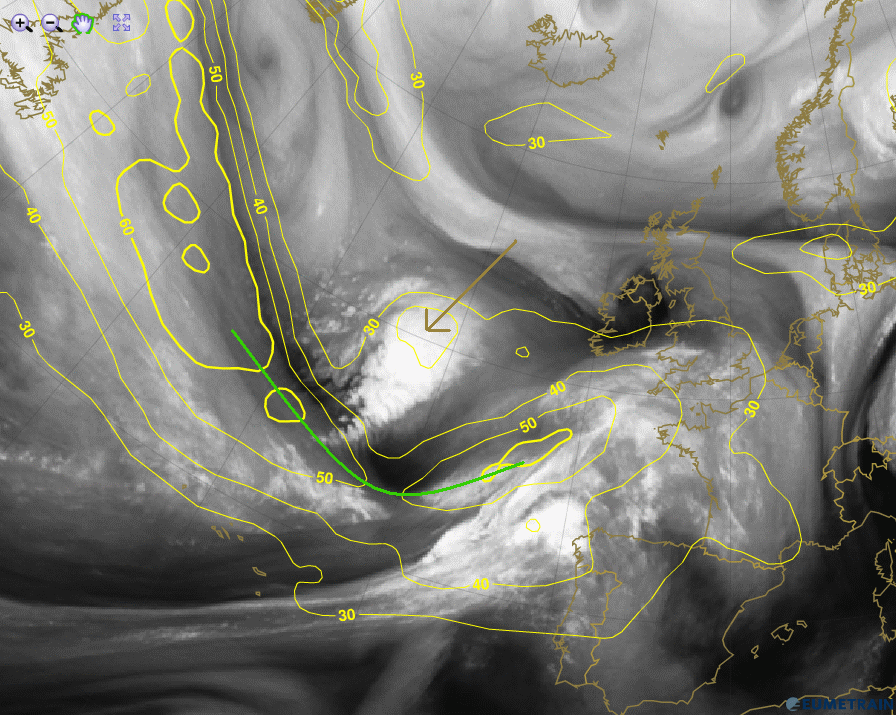 |
b) 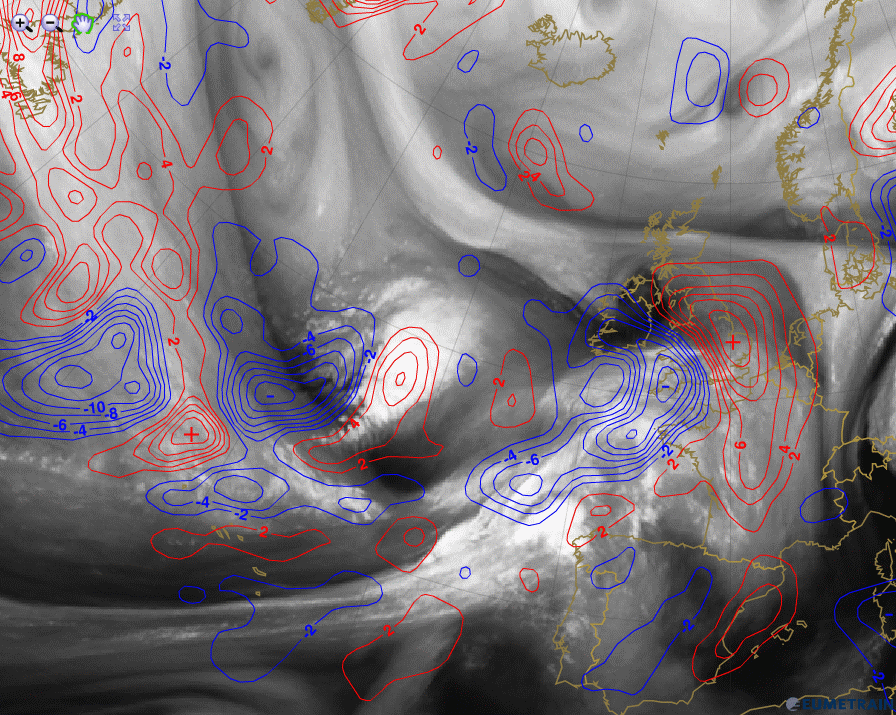 |
c) 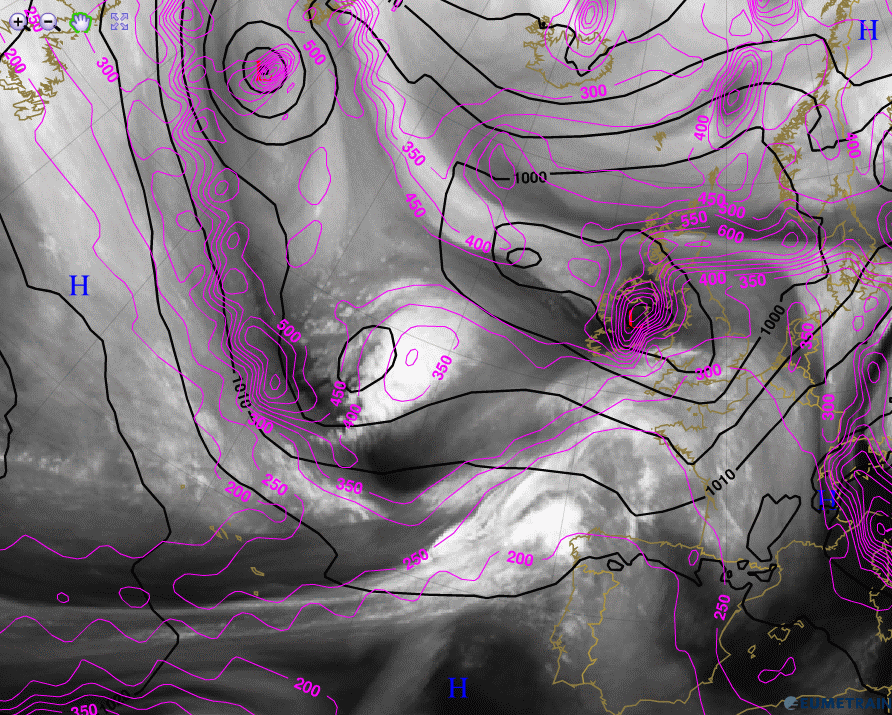 |
d) 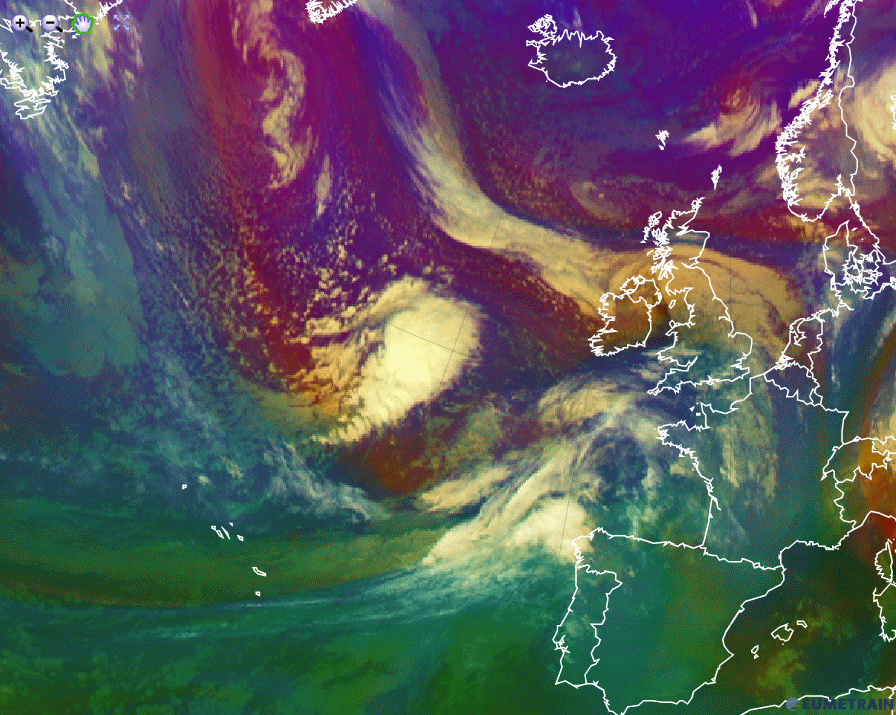 |
Figure 4a - 4d: WV 6.2 µm and Air Mass satellite image from 16th October 2012, 00:00 UTC.
a) WV 6.2 µm image and ECMWF Isotachs 300hPa (yellow)
b) WV 6.2 µm image and ECMWF thermal advection at 700hPa (warm: red, cold: blue)
c) WV 6.2 µm image and ECMWF mean sea level pressure (black) + height of isentropes with PV=1.5 PVU (pink)
d) Air Mass RGB
By 06:00 UTC on 16 October 2012 the leaf had evolved into a comma as the structure developed a definite cusp (figure 5a). Taking a closer look at the comma pattern, it seems that the cloud head developed first, signifying a mid-level cloud extrusion from beneath the cold cloud shield. The temperature advection field (figure 5b) still shows the warm and cold advections. From the PV=1.5 PVU height (figure 5c) it can be seen that the development is ongoing and not yet completed, as the PV minimum only now starts to interact with the surface low. In figure 3d (15 Oct 18 UTC) and figure 4c (16 Oct 00 UTC) the PV maximum related to the jet axis is more or less a straight line. As the cyclogenetic process continues, surface and upper level circulations begin to interact and the PV anomaly approaches the low pressure center. As can be seen in figure 5c, this process has only just started. When the dark stripe (the PV maximum) is above the low pressure center, the cyclogenesis has reached its mature stage.
a) 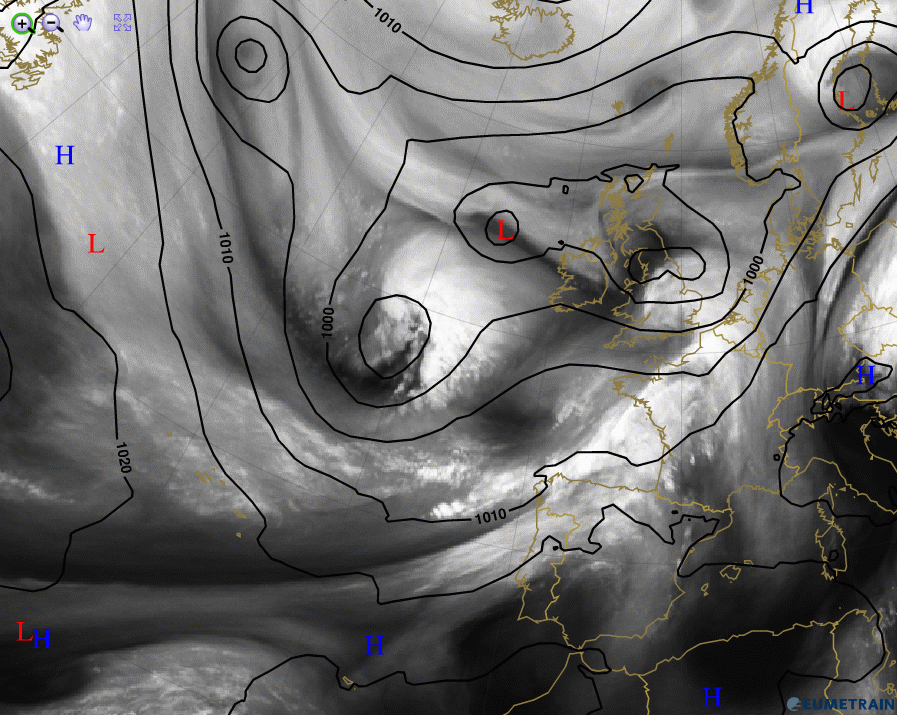 |
b) 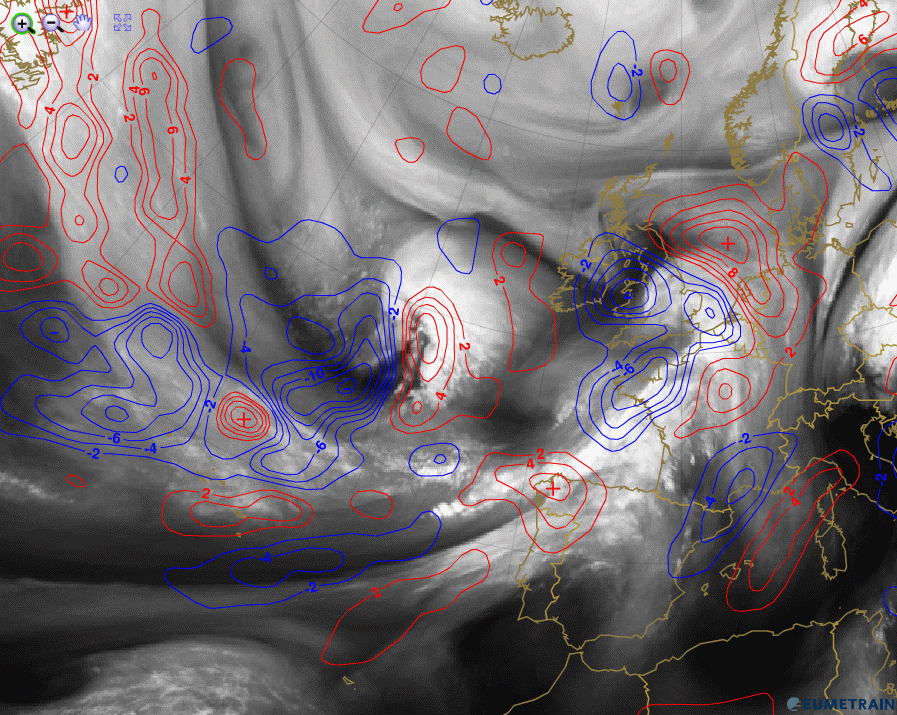 |
c) 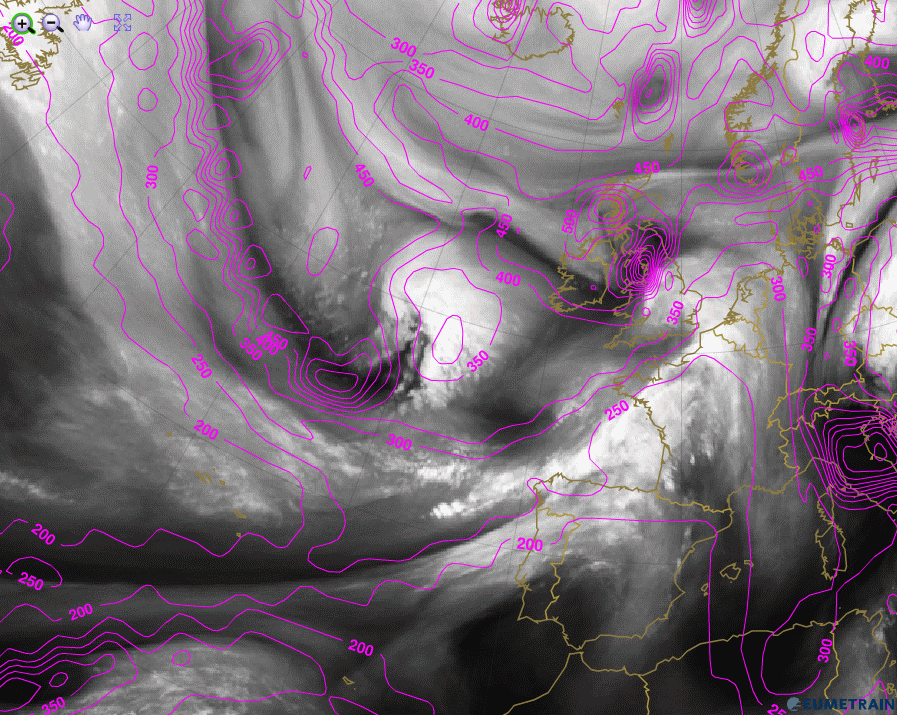 |
d) 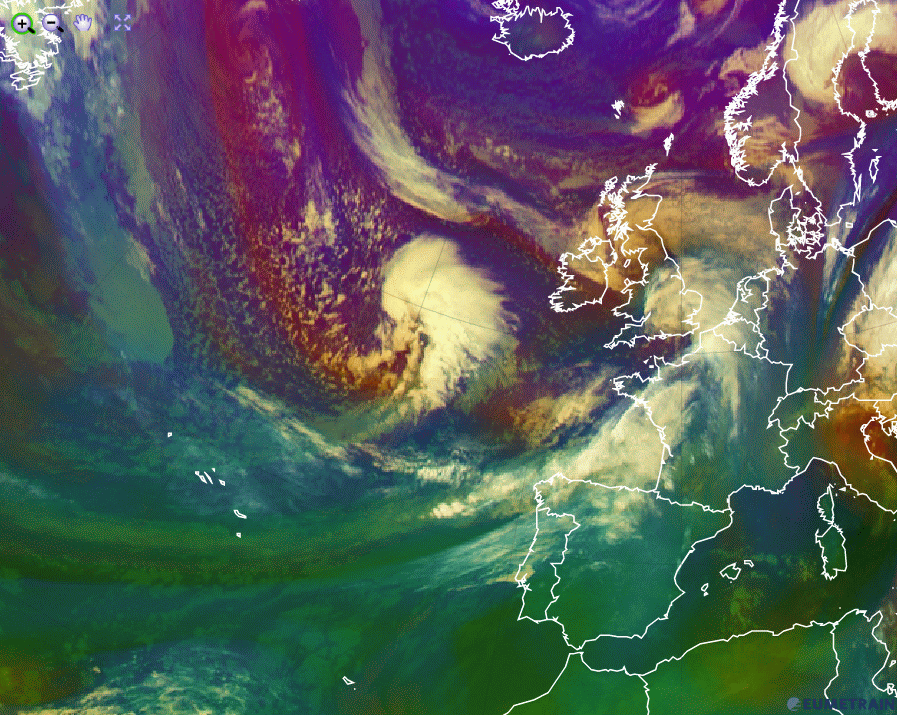 |
Figure 5a - 5d: WV 6.2 µm and Air Mass satellite image from 16th October 2012, 06:00 UTC.
a) WV 6.2 µm overlaid with ECMWF Mean Sea Level Pressure (black)
b) WV 6.2 µm overlaid with ECMWF Thermal advection in 700hPa (warm: red, cold: blue)
c) WV 6.2 µm overlaid with ECMWF Height of Isentropes with PV=1.5 PVU (pink)
d) Air Mass RGB
Another six hours later (12:00 UTC), the comma has transformed into a vortex and the surface low has deepened from 1000 hPa to 985 hPa within twelve hours (figure 46). A closer look at the Air Mass RGB (figure 6b) shows that there is still potential for further development as the red stripe indicating a tropopause folding is still present. This tropopause folding is also visible in the VCS which runs from the occlusion southeastwardly to Northern Africa (the blue line in figure 6c). This VCS is shown in figure 6d. The potential vorticity minimum between 50°N and 46°N corresponds to the dark red stripe in the Air Mass RGB.
a) 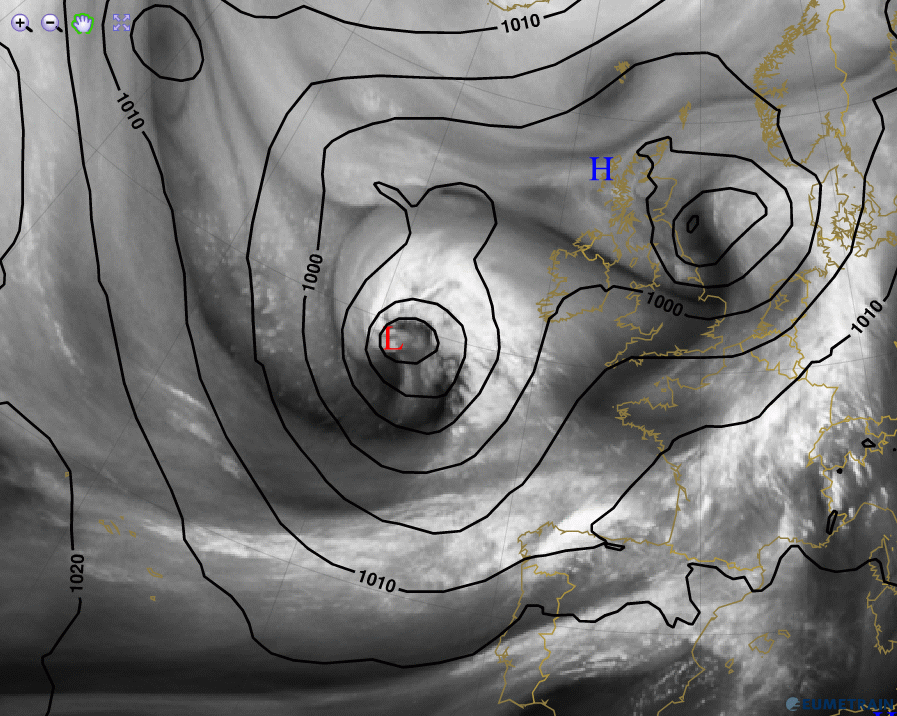 |
b) 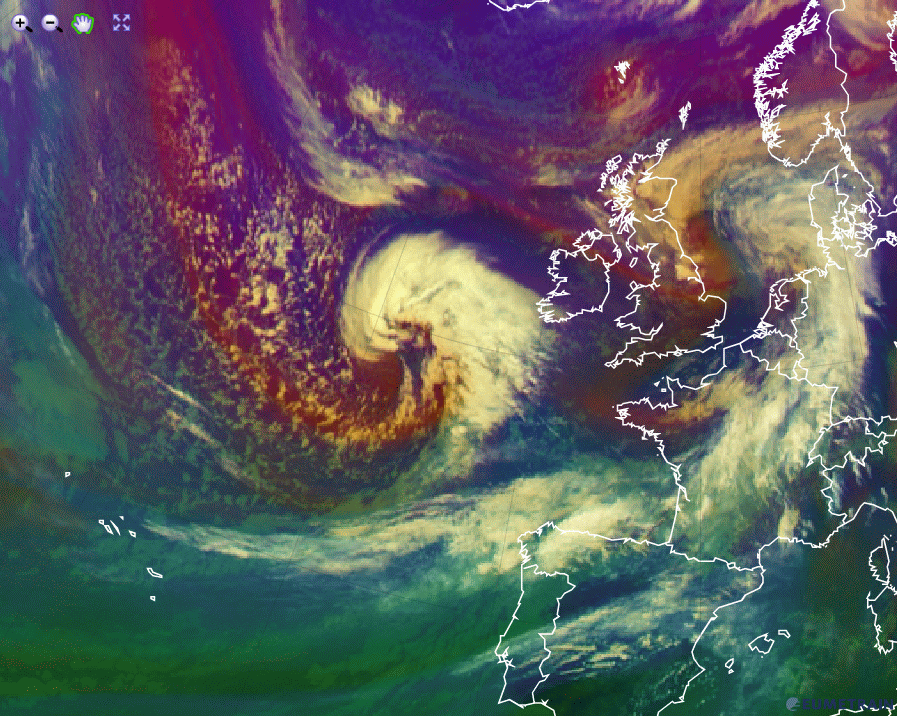 |
c) 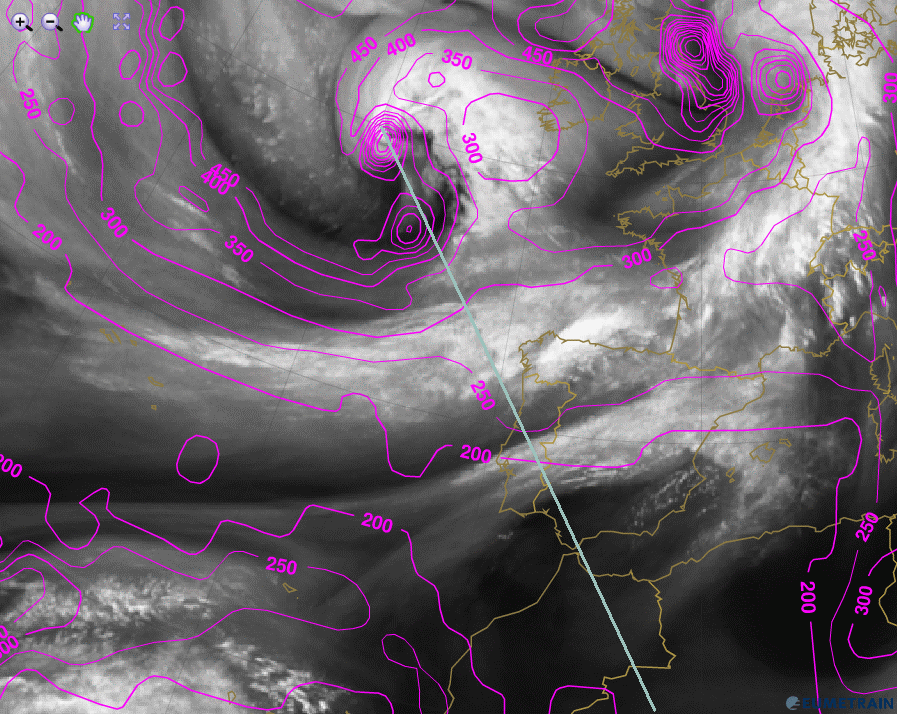 |
d) 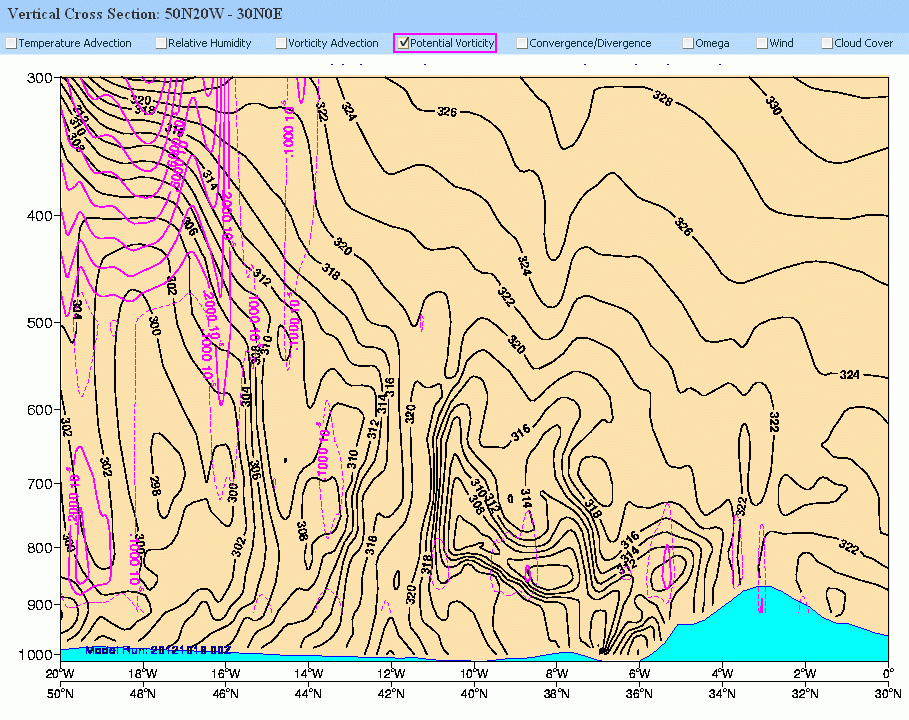 |
Figure 6a - 6d: WV 6.2 µm and Air Mass satellite image from 16 October 2012, 12:00 UTC.
a) WV 6.2 µm image and ECMWF mean sea level pressure (black)
b) Air Mass RGB
c) WV 6.2 µm image and ECMWF PV=1.5 PVU. Position of the vertical cross section (blue line)
d) Vertical cross section extending from 50°N 20°W to 30°N 0°W showing the isentropes (black) and the potential vorticity (pink)