Synoptic Situation and Satellite Overview
Frontal cloud band is moving from the Atlantic towards East Europe. The cold front is a part of a wider system; a deep cyclone with an occluded front and a weak warm front. The centre of the cyclone is located near Iceland and the occluded front is extending from NW to SE above Great Britain and northern France. This is showed on the synoptic chart of March 10th 2006 at 00 UTC.
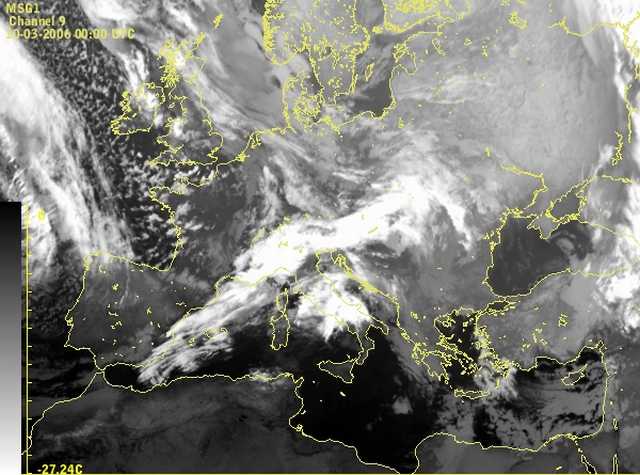
10 March 2006; 00 UTC
|
|
By following the chapters below you may look at the stages of the development as seen in the satellite images and basic meteorological fields:
Satellite overview
The motion of the cold front from northwest towards eastern Europe and other associated meso-features can be seen in the relevant sequences of satellite images with 2-hour intervals:IR Imagery (Meteosat-8: 10.8 µm channel)
WV Imagery (Meteosat-8: 6.2 µm channel)
Meteosat-8 composite WV6.2-WV7.3; IR9.7-IR10.8; WV6.2i µm (Airmass RGB)
Basic explanation of the RGB combinations of satellite images and their advantages can be found in the MSG Interpretation Guide.
Basic synoptic parameters The cloud configuration in satellite images combined with the basic field of geopotential height in 1000 hPa are shown here in the sequence with 6-hour intervals:
IR images and Geopotential height at 1000 hPa
Situation in the upper levels is depicted by the combination of the satellite images and the 500 hPa height in 6-hourly sequence.IR images and Geopotential height at 500 hPa
Situation in temperature field is shown on 700 hPa surface in 6-hourly sequence.IR images and Temperaure field at 700 hPa
Summary In this chapter a synoptic scale feature, the cold front, can be analysed through several types of satellite images combined with basic synoptic parameter fields. Apart from the cold front and the development of two waves, some other features can be discerned on the images. The most obvious one is a jet fibre along the front and the CBs developing in the northern Italy after the passage of the front.