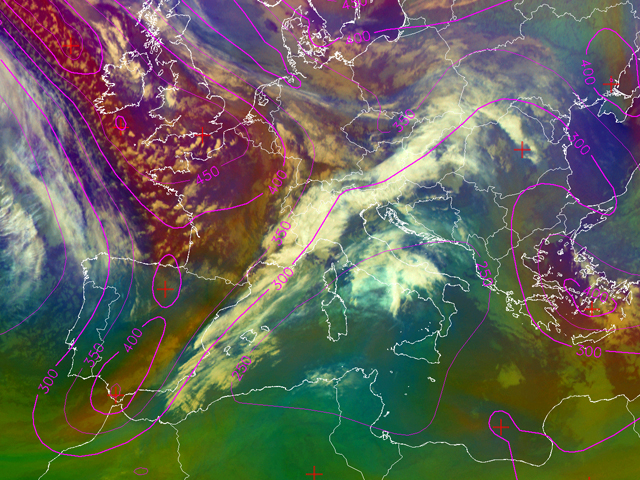
10 March 2006, 00 UTC
The height of PV=1 is superimposed on the Airmass RGB images. High values coincide with the red areas and red stripes seen in the set of images. Peaks can be seen at
the rear side of frontal cloudiness, one over Spain and the second one, wich is more intense, over Great Britain. As already mentioned before dry stratospheric air
can be conected to cyclogenesis. The gradient of height of PV=1 unit lies above
the Wave and this is
a key parameter for the Wave with double structure.
10 March 2006, 06 UTC
In the last 6 hours a cloud spiral developed and it is now located over Austria,
Hungary and Croatia. Another Wave on the front will develop in few hours due to
existing conditions for cyclogenetic process, a PV maximum near
the Baleari Islands.
10 March 2006, 12 UTC
At this instant the cloud spiral is weakening and dissipating. The new wave is further developing, there is a
pronounced PV anomaly behind the frontal cloud band. It
is
associated with dry stratospheric air protruding downward.
10 March 2006, 18 UTC
The narrow elongated zone of high PV values stretches from north-west (Great Britain and Iceland) towards northern Italy. This PV
anomaly
combined with a pressure
trough at 500 hPa (see chapter 'IR images and Geopotential height at 500 hPa') causes convective development over northern Italy.
11 March 2006, 00 UTC
Because dry air with high values of PV is overrunnig the system one can already observe clouds lowering and dissipating, especially in the southern part of frontal
cloudiness. The whole system is slowly weakening.