Chapter III: Numerical simulation
Table of Contents
Chapter III
The non-hydrostatic WRF model (Skamarock et al., 2008) of 2.7 km horizontal resolution was used for experimental forecasts of thunderstorms over Belgium. The resolution and setup of the physical parameterization was nearly the same as for the version operationally used at the Hungarian Meteorological Service. Although the model dynamics at this resolution are able to produce updrafts of an intensity that is usually observed in thunderstorms (i.e. 10-20 m/s), it must be emphasized that the deep convection was only partially resolved in these simulations (higher resolution or special physical parameterization would be required for more realistic results). Nevertheless, the model outputs show several convective cells developing over Belgium and propagating in the southwest-northeast direction, even close to the area of the festival (Fig. 3.1). In the study, we concentrated on the intense cell, which passed about 35 km southeast of Hasselt.
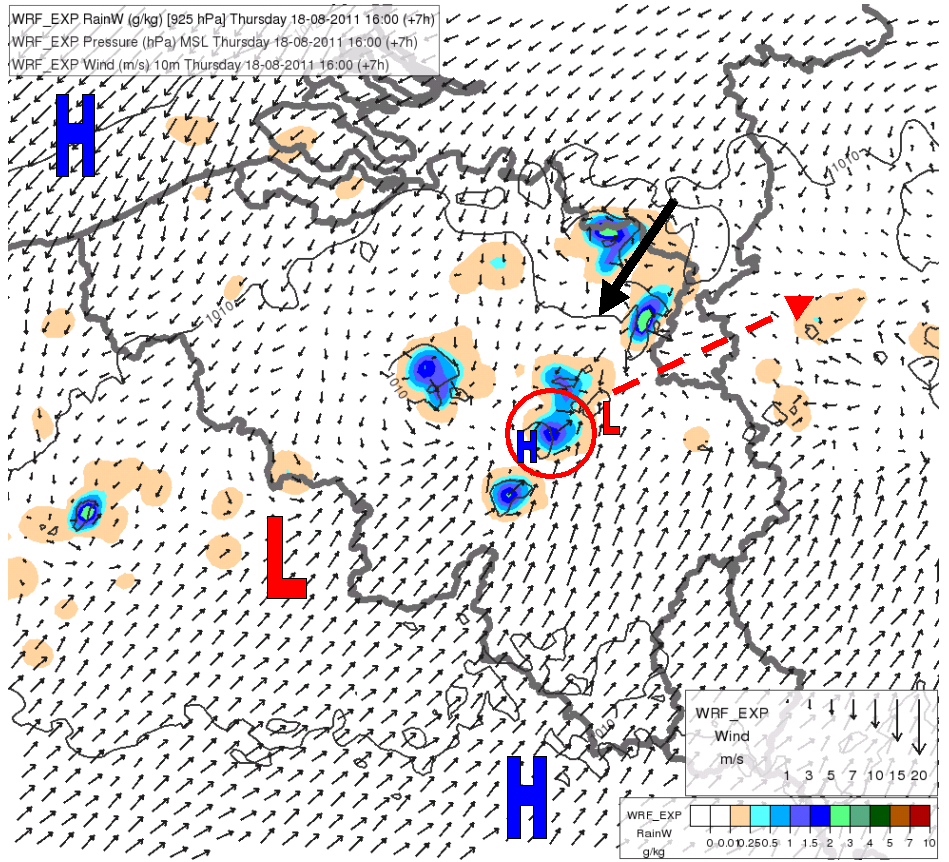
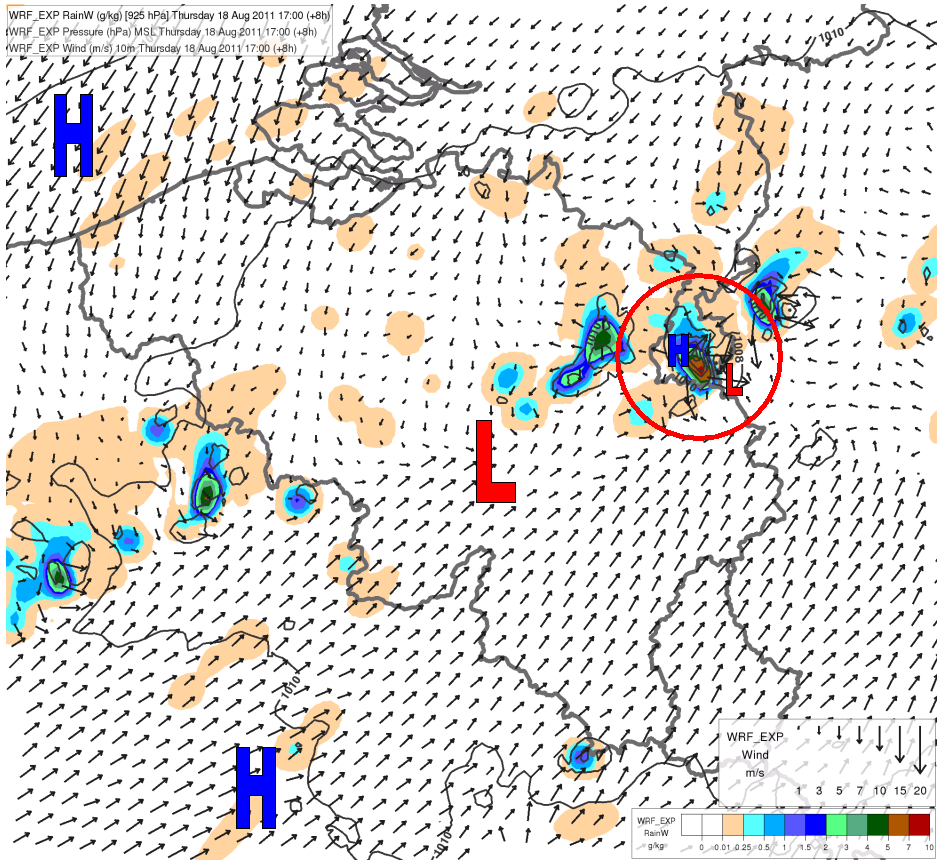
Fig. 3.1. WRF 7 and 8 h forecasts for 18 August 2011 16 UTC (above) and 17 UTC (below): rain water at 925 hPa (colors), wind (arrows) at 10 m and mean sea level pressure (black lines, by 2 hPa). The circles emphasize the cell, which was investigated in more detail. The solid black arrow points toward Hasselt. The dashed red arrow shows the direction of the cell propagation. The letters H and L show the areas of high and low pressure.
Forecast of severe outflow
The WRF forecasts predicted very strong, divergent outflow at the surface (Fig. 3.2), which is a typical characteristic of a downburst. The parameterization indicated gusts of up to 40 m/s (by 10 m model average winds exceeding 20 m/s). The center of the divergent winds is situated below or in the neighborhood of the strongest downdrafts, the maximum speed of which was about 8 m/s (not shown). This value is quite high at this resolution, at least compared to the forecasts of downdrafts in thunderstorm cells during average conditions (in which maximum velocity is usually 3-4 m/s). The downdraft speed in real conditions may have been higher.
The other reason for the intense outflow is the strong pressure gradient at low levels, which formed between the meso-low at the forward flank of the cell and the meso-high below the downdraft (indicated in Fig. 3.1).
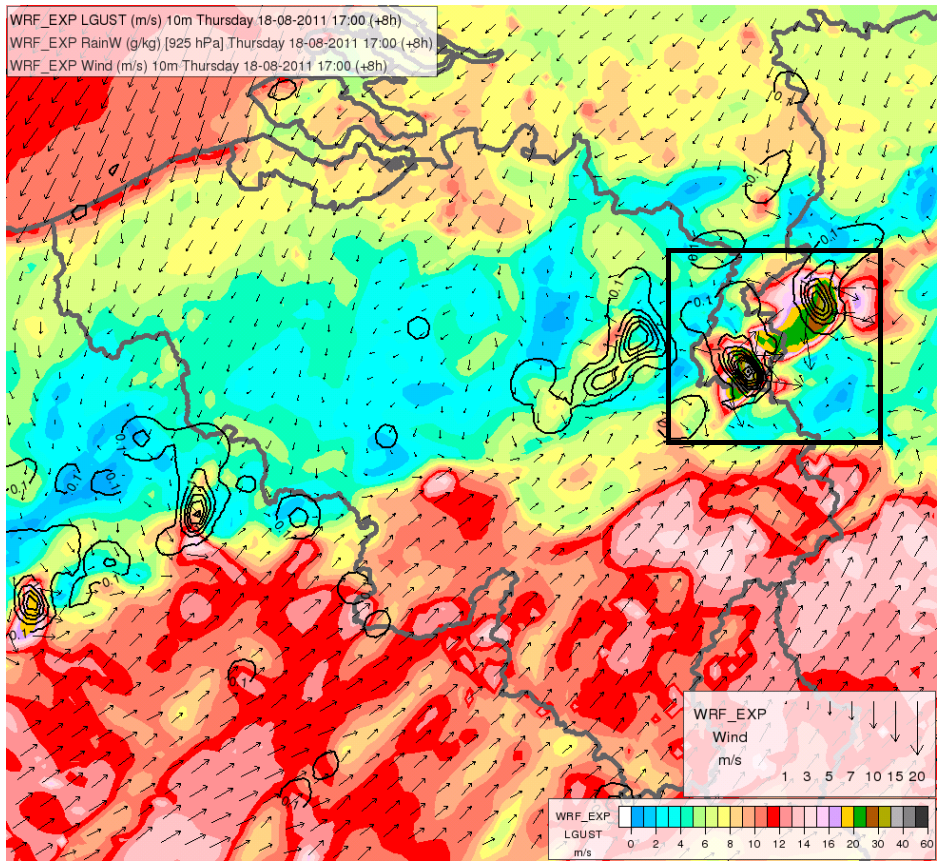
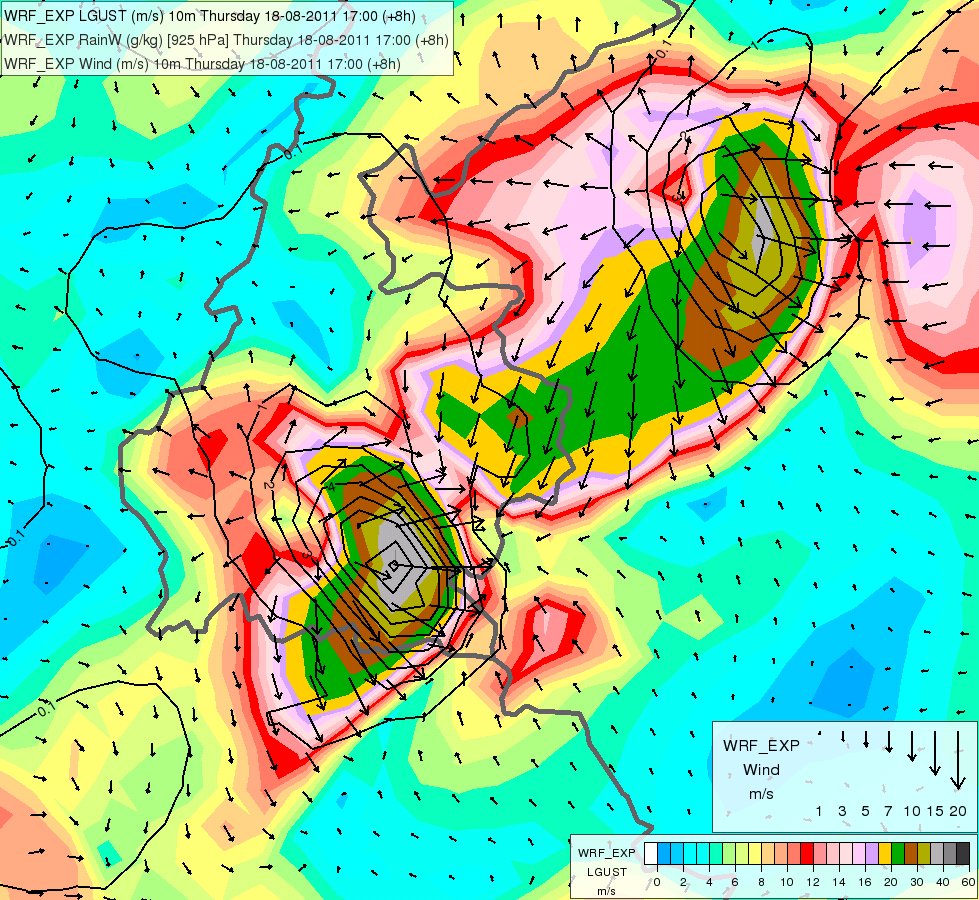
Fig. 3.2. WRF 8 h forecasts for 18 August 2011 17 UTC: wind gust-speed at 10 m (colors), rain water at 925 hPa (black lines) and wind vectors at 10 m. The zoomed area (rectangle) of the investigated cell is shown on the right of the image.
Relationship between the environmental moisture distribution and convective downdrafts
The main environment characteristics in the WRF simulation are similar to those forecast by ECMWF (which provided boundary and initial conditions for the WRF model). There was a southeasterly-easterly storm-relative inflow of warm and moist air at low levels (Fig. 3.3). The thunderstorms produced rather isolated outflows, which can be observed as local minima in the field of the equivalent potential temperature. A larger cold pool developed only in the forecast valid for 18 UTC over the west of Germany (not shown). At mid-levels (600 hPa), there was a "tongue" of dry air spreading from France toward the thunderstorm. In this level, the local maxima of the equivalent potential temperature are areas of the thunderstorm updrafts, which transport the moist air to the upper levels.
The southwest-northeast vertical cross-section of the equivalent potential temperature and storm-relative wind projected to the cross-section plane (Fig. 3.4) shows that the environmental dry air at 4 km could have entered the downdraft area in the rear of the thunderstorm. Thus, the downdraft seems to be connected with the meso-alpha synoptic region of dry mid- and upper air, which was detected in the satellite imagery.
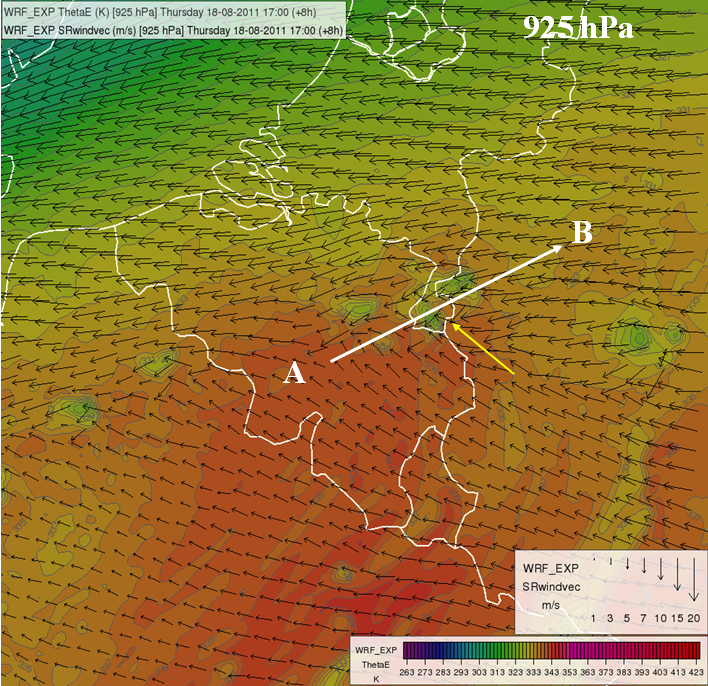
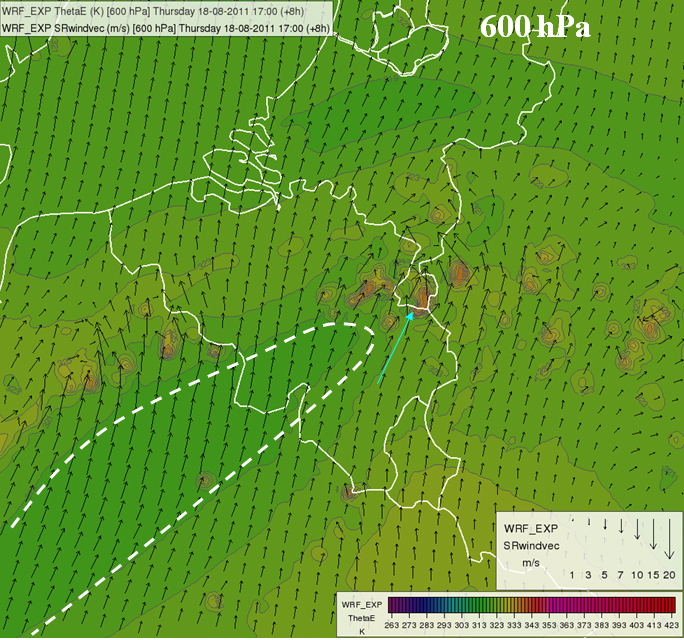
Fig. 3.3. WRF 8 h forecast for 18 August 2011 17 UTC: equivalent potential temperature (colors and gray contours) and storm relative wind vectors at 925 hPa (above) and 600 hPa (below). The white arrow and the A and B letters indicate the location of the vertical cross section analyzed in the next figure. The yellow arrow shows the direction of the storm relative inflow. The dashed white line in the panel below shows a 'tongue' of low equivalent potential temperature.
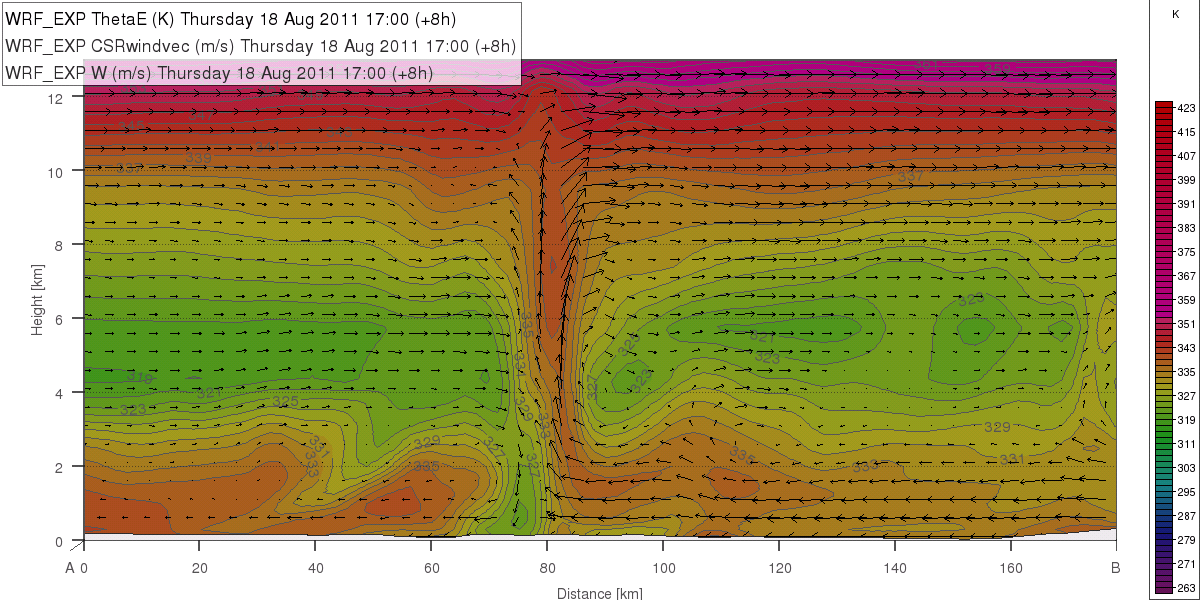
Fig. 3.4. WRF 8 h forecast for 18 August 2011 17 UTC shown along the vertical cross section indicated in Fig. 3.3. Equivalent potential temperature (colors and gray contours, K), cross section and storm-relative wind vectors (arrows, m/sec)