Chapter II: Description of the synoptic situation
Table of Contents
Chapter II
At 12 UTC on 18 August 2011, a shallow low was situated over France, Belgium and western Germany. The area of Hasselt was very close to a warm front related to this low (Fig. 2.1). The surface low deepened and propagated over Belgium toward the northeast.
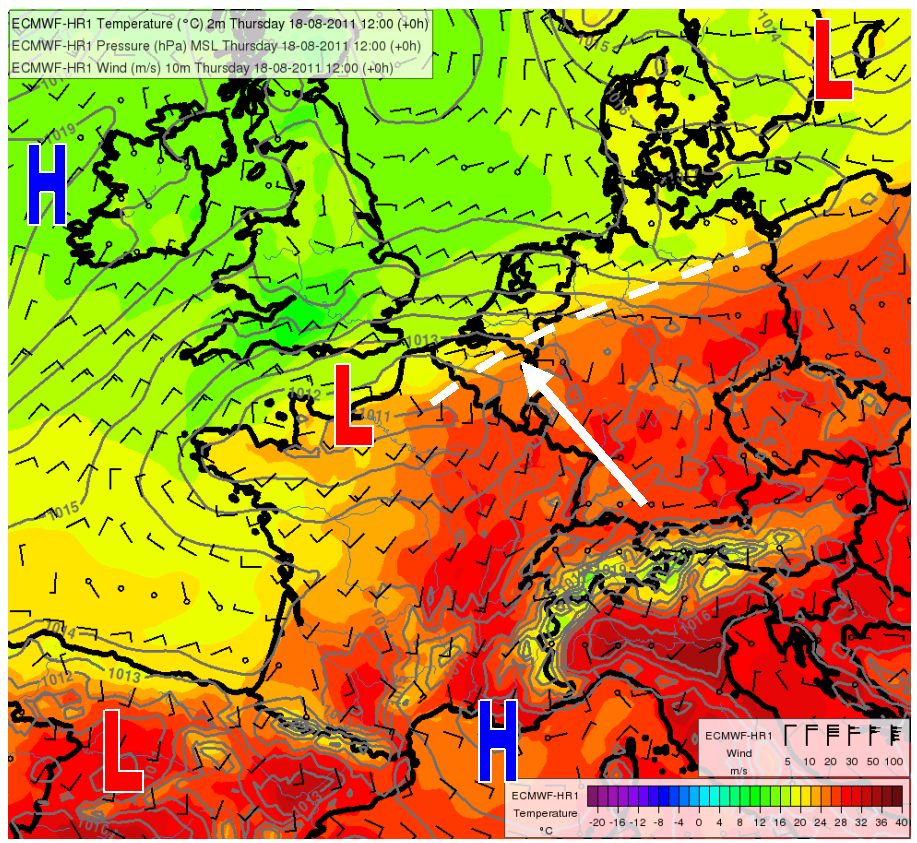
Fig. 2.1. ECMWF analyses of mean surface level pressure (lines by 1 hPa), 2 m temperature (color) and 10 m wind (barbs) valid for 18/08/2011 12 UTC. The dashed line emphasizes the area of high temperature gradients (probably a warm front). The arrow indicates the location of the pop festival. The L and H symbols represent lows and highs, respectively.
At 500 hPa level, there was moderate-to-strong southwesterly upper-air flow at the forward flank of the trough with an axis over Ireland (Fig. 2.2).
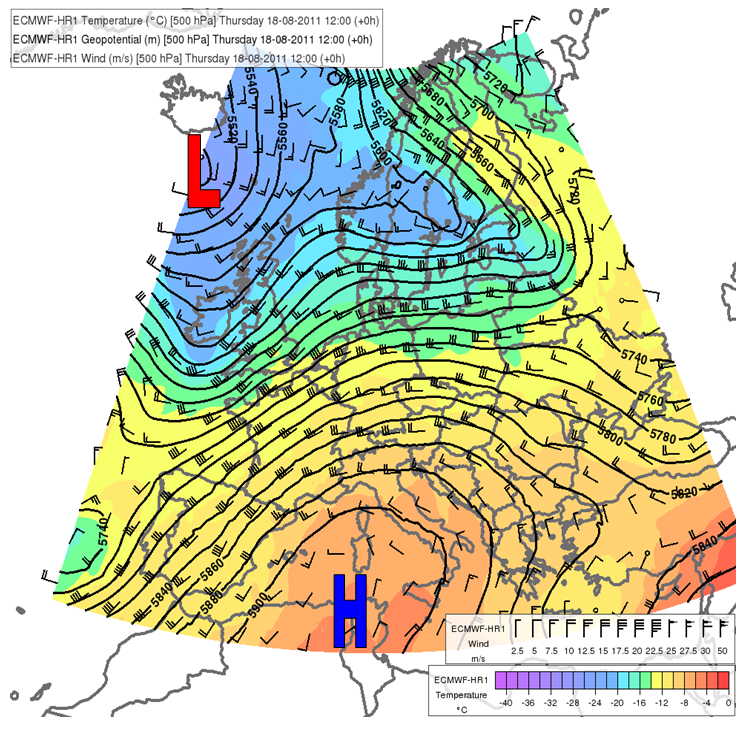
Fig. 2.2. ECMWF analyses for 18 August 2011 12 UTC. Geopotential height (lines), temperature (color) and wind barbs at 500 hPa. The L and H symbols represent lows and highs, respectively.
Thunderstorm environment
The ECMWF analyses and forecasts of the low-level equivalent potential temperature and wind indicate a southerly advection of moist, warm air toward Belgium and western Germany (Fig. 2.3). The vertical cross-section shows that the warm and moist air-mass at the surface was overrun by relatively dry mid-level air with low equivalent potential temperature advecting from the southwest (Fig. 2.4). This situation shows some similarities with the "Spanish Plume" conceptual model. The air was conditionally unstable and the largest vertical gradients of the equivalent potential temperature were probably close to the borders of Belgium, the Netherlands and Germany, as shown by the section. This assumption is supported by several diagnostic parameters computed from the ECMWF model. The surface-based CAPE (SBCAPE) predicted over Hasselt at 18 UTC is 1000-1250 J/kg (Fig. 2.5a) but the model forecasts indicate even higher instability of air in some other regions of Belgium (up to 2000 J/kg). The DTHETAE2 index (Simon et al., 2011) was used to diagnose areas with high vertical gradients of equivalent potential temperature:
![]()
where Theta e is the equivalent potential temperature.
Similar indices, e.g. TED (Ellrod et al., 2000) are commonly used for estimating the downburst potential because high values are usually related to the presence of dry environmental air at mid-levels, which can be, eventually, mixed with the descending cloud air. Subsequent evaporation of rain water and diabatic cooling might increase the negative buoyancy and the intensity of the downdraft and outflow. The DTHETAE2 values exceeding 20 K over northern Belgium are significant, generally favorable for downburst occurrence (Fig. 2.5b). High instability of air was also accompanied by moderate (15-16 m/s) 0-6 km wind shear (not shown). Mesocyclogenesis (supercell mesocyclones, mesovortices) can also occur in an environment with such moderate shear, particularly in areas of high CAPE (because the initially weak rotation can be enhanced by stretching of the air column in the thunderstorm updraft due to high vertical acceleration). It is notable that according the ECMWF outputs, the 0-6 km shear was higher in the western part of Belgium (up to 20 m/s).
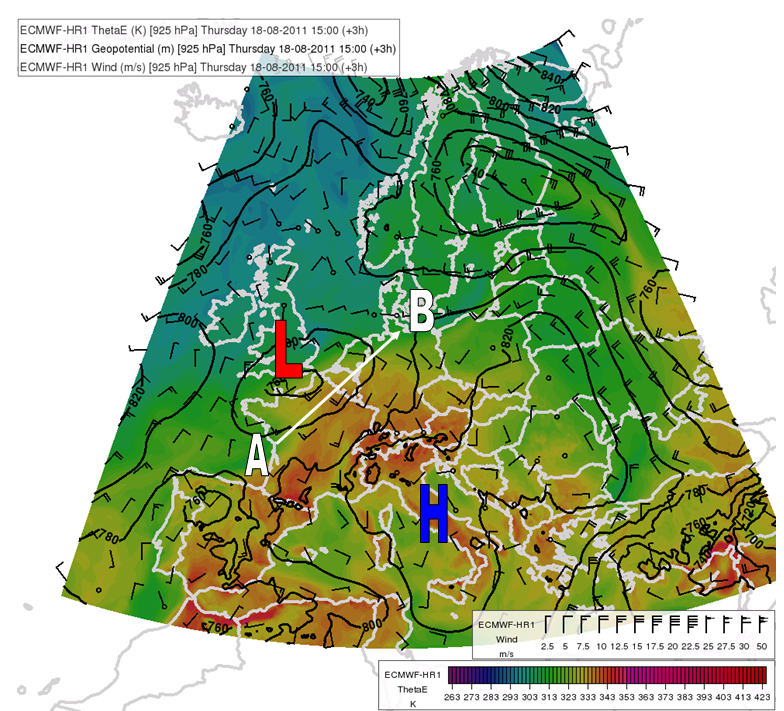
Fig. 2.3. ECMWF 3 hour forecast for 18 August 2011 15 UTC. Equivalent potential temperature (colors), geopotential height (black lines) and wind barbs for 925 hPa. The white arrow and the A and B letters indicate the sense of the vertical cross section analyzed in the next figure. The letters H and L indicate highs and lows in the geopotential field.
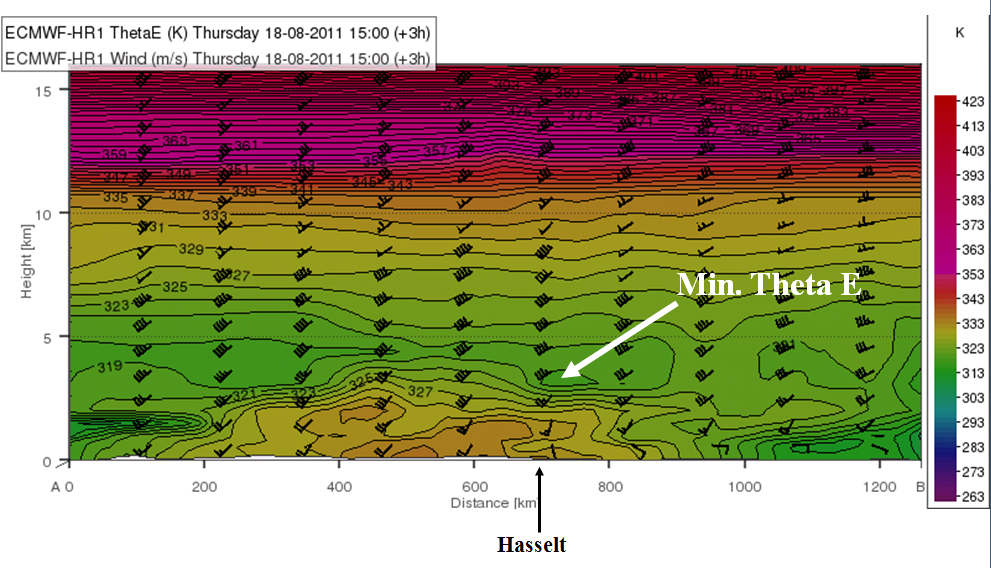
Fig. 2.4. ECMWF 3 hour forecast for 18 August 2011 15 UTC shown along the vertical cross section indicated in Fig 2.3. Equivalent potential temperature (colors and black contours) and wind barbs.
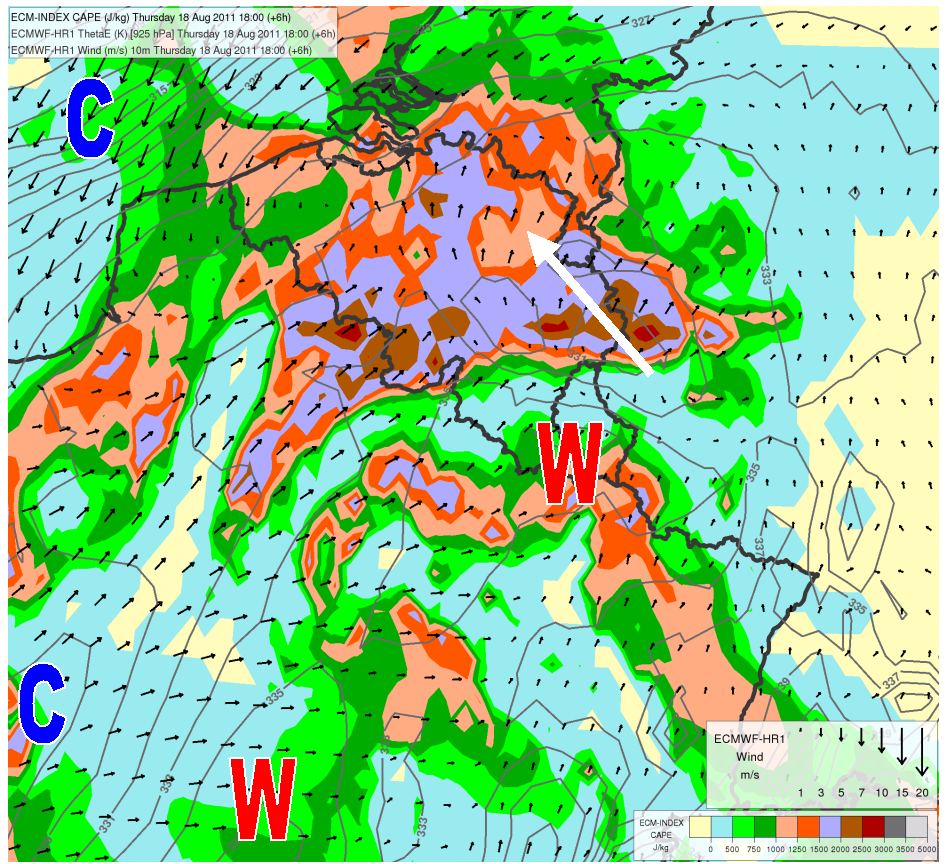
Fig. 2.5a. ECMWF 6-hourly forecast for 18 August 2011 18 UTC. ECMWF derived indices: surface based CAPE (SBCAPE) (colors) and equivalent potential temperature at 925 hPa (gray solid lines). The letters C and W indicate minima and maxima, respectively, of the equivalent potential temperature field. Arrows depict the 10 m wind. The big arrow indicates the location of the city of Hasselt.
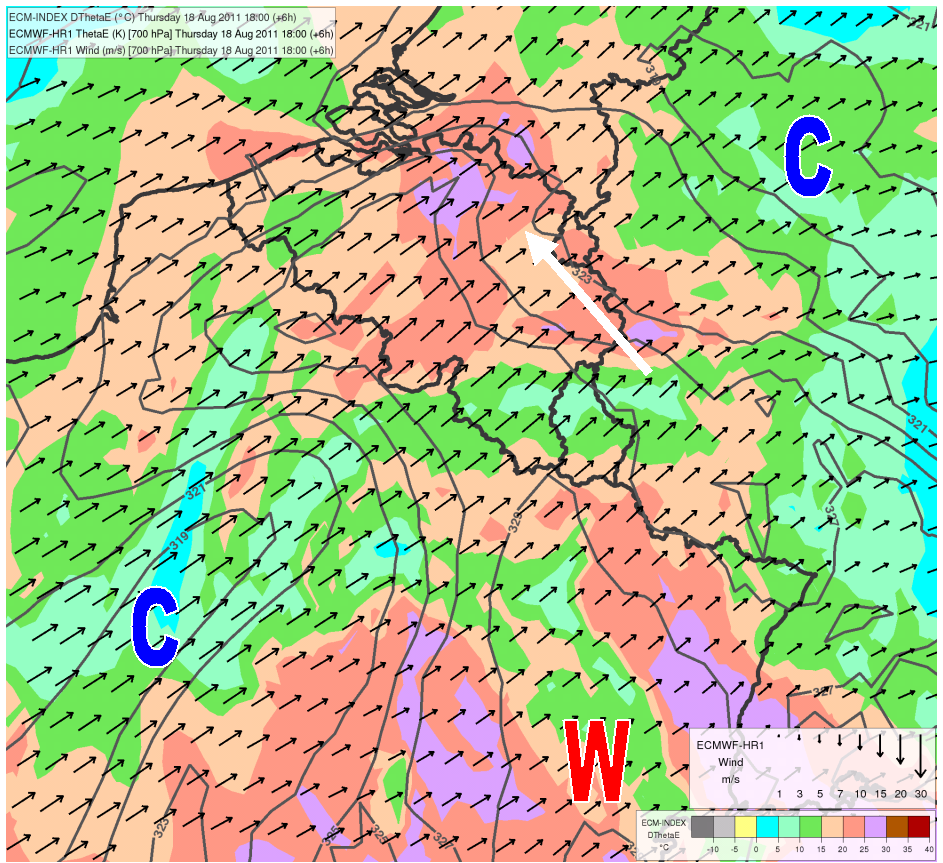
Fig. 2.5b. As in 2.5a but for the DTHETAE2 parameter (colors) and equivalent potential temperature (grey solid lines) and wind (arrows) at 700 hPa.
Patterns of mid- and upper tropospheric dryness
The 6.2 and 7.3 µm water vapour channels of the METEOSAT-9 satellite provide observational evidence of dry air in the upper and mid-levels of the troposphere. The satellite imagery was combined with relative humidity fields from the ECMWF model (Fig. 2.6). Dark stripes in the water vapour images seem to be closely related to areas of dry air in the ECMWF forecasts for 400 and 600 hPa, respectively. The environmental dryness at the 600 hPa level (relative humidity well below 30 %) might be important because it is often expected (e.g. by computation of the Downdraft Convective Available Potential Energy, DCAPE) that thunderstorm downdrafts initiate at this height.
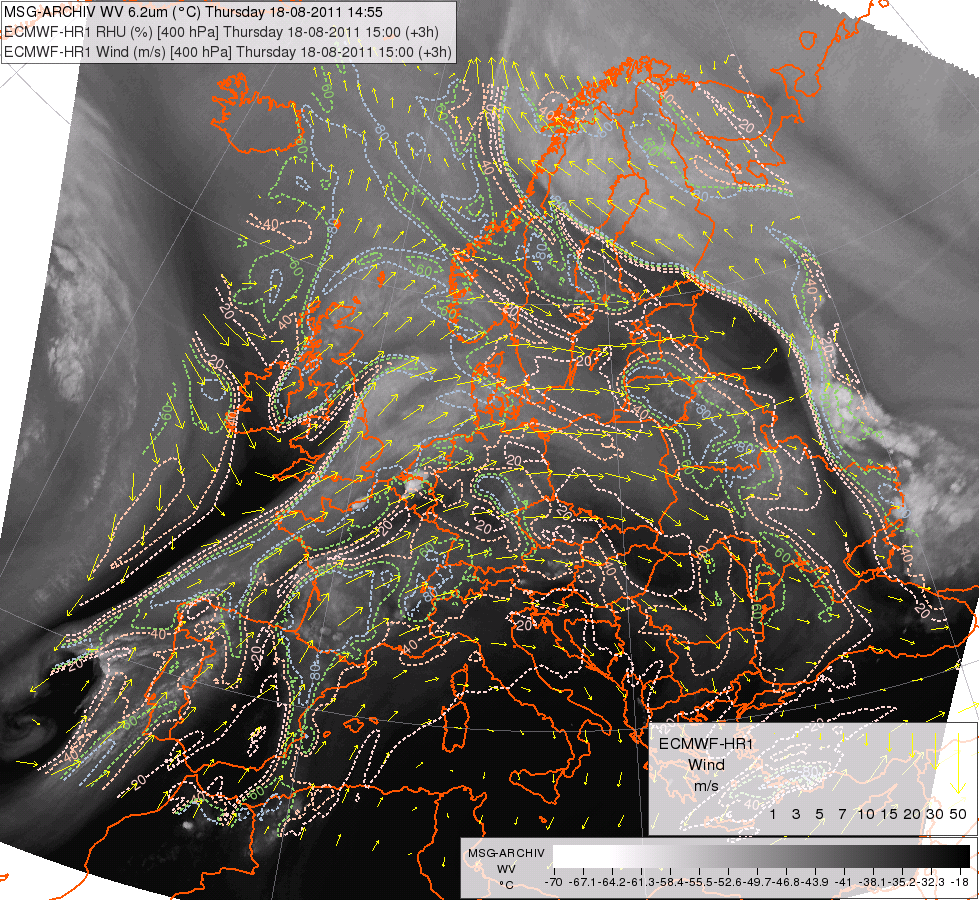
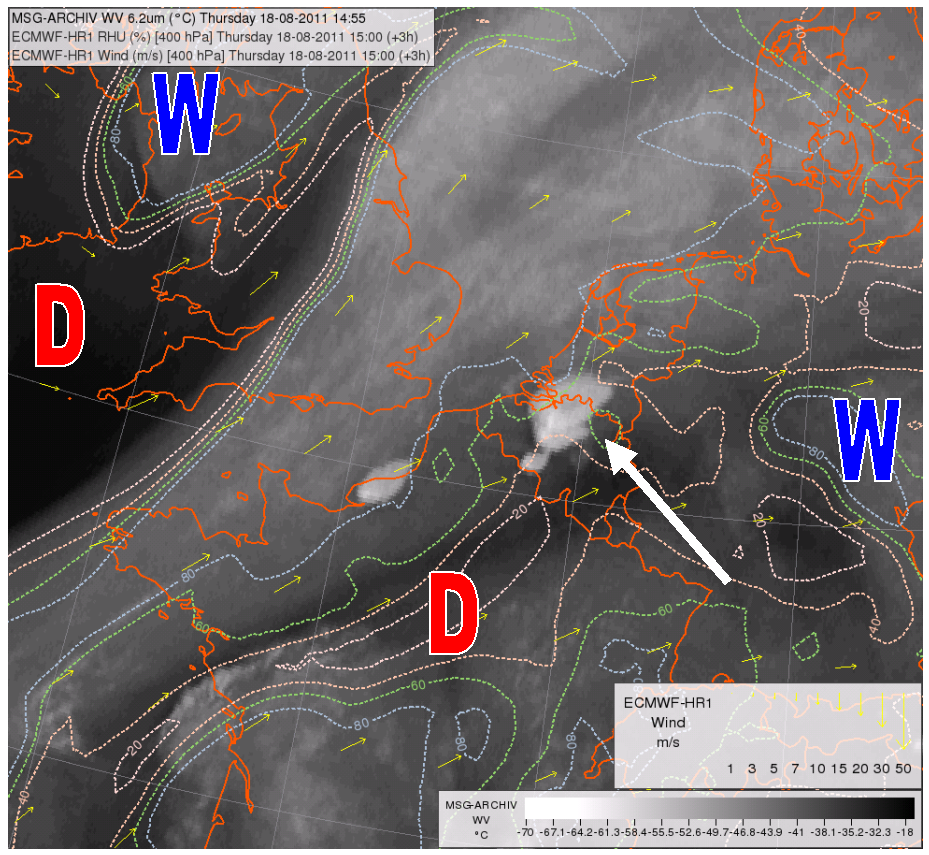
Fig. 2.6a. Meteosat-9 WV6.2 image for 14:55 UTC overlaid by 3 hour ECMWF forecast for 15 UTC: relative humidity (colored dashed lines) and wind (arrows) at 400 hPa for the whole of Europe (left) and in a close-up look (right). The areas with relative humidity exceeding 80 % and below 20 % are shown by the letters W and D, respectively. The arrow indicates the location of Hasselt.


Fig. 26b. Meteosat-9 WV7.3 image for 14:55 UTC overlaid by 3 hour ECMWF forecast for 15 UTC: relative humidity (colored dashed lines) and wind (arrows) at 600 hPa for the whole of Europe (left) and in a close-up look (right). The areas with relative humidity exceeding 80 % and below 20 % are shown by the letters W and D, respectively. The arrow indicates the location of Hasselt.