Synoptic Situation
The synoptic situation on 27 July 2006 was characterized by an upper trough over western Europe and a ridge over central Europe. With approaching of the trough the potential unstable air was lifted. Supported by solar insolation, single cells and multi cells as well as super cells developed over eastern France and Germany. Till afternoon, a squall line formed over Germany which could be clearly recognized in the radar and lightning data. The surface pressure tendency revealed the typical dipole structure with decreasing surface pressure in the leading part (with relatively warm air) and increasing surface pressure in the rear part of the squall (relatively cool air). The warm air was lifted and the cold air moved downward. When this process happens at a frontal zone we call this a thermal direct circulation yielding an intensification of the front.Gusts of 51 knots (Beaufort 10) and precipitation amounts of up to 63 l/m² within 3 hours were reported.
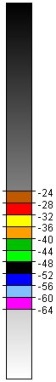
The IR 10.8 (Enhanced) satellite images below show the development of the convective structures as a time sequence from 12 UTC to 18 UTC. At 12 UTC only a few cells can be observed. However, relatively fast, two super cells developed over central and northern Germany, respectively. Till late afternoon a squall line established. Cloud top temperatures were below -64°C which is equivalent to a high risk of hail. After 16 UTC the convection weakened and till 18 UTC the cloud top temperature increased continuously above -60°C.
Although we will concentrate upon Central Europe also a very instructive example of convection's triggering over parts of West Europe will be discussed.
27 July 2006, 12.00 UTC - Meteosat-8 IR 10.8 Enhanced
|
Cloud top temperatures [°C]
|
Satellite Overview
Meteosat-8 IR10.8 Enhanced time sequence [30-60min]
The first chapter dealing with the synoptic situation describes the development seen with infrared imagery. An animation of the IR10.8 channel is presented with enhanced colours. This enhancement enables us to study the different cloud top temperatures more in detail. Convective hotspots can be located.
Meteosat-8 WV6.2 time sequence [1h]
In this chapter the development seen in water vapour imagery is described. Hourly sequences are shown.
RGB Composites
Convective Storms RGB: Meteosat-8; 6.2-7.3, 3.9-10.8, 1.6-0.6: time sequence [15-30min]
In this chapter the convective development over western and central Germany is studied using the "severe convection RGB". The rapid development stages will be observed in a 15 or 30 minute time sequence.
Airmass RGB: Meteosat-8; 6.2-7.3, 9.7-10.8, 6.2i: time sequence [1h]
In this chapter the convective processes are studied using the Airmass RGB.This composite gives information about different airmasses in relation to cloud structures. Additionaly, it gives hints to relevant dynamical processes for convective processes (e.g., PV maxima). An hourly time sequence is pictured.
Comparison of Satellite Products
RGB HRV, HRV, 10.8 vs. IR 10.8 Enhanced: time sequence [1h]
In this chapter two satellite image products with different spectral information and spatial resolution are compared in respect to relatively small convective cells. Some advantages and shortcomings of the different products will be discussed.
Basic Synoptic Parameters
Surface analyses by DWD, IR10.8: time sequence [1h]
In the first chapter dealing with synoptic parameters surface analysis products are used for an overview of the synoptic situation.
Geopotential height 300 hPa, IR Images: time sequence [6h]
In the following chapter the cloud configurations seen in satellite images are related to the basic field of the upper level height in 300 hPa. Only model fields for 12 UTC and 18 UTC can be presented.
Surface pressure tendencies, IR10.8: time sequence [1h]
In this chapter the pressure tendencies are shown in an hourly time sequence in order to investigate mesoscale structures more carefully.
Pseudopotential temperature and wind, IR10.8: time sequence [1h]
In this chapter pseudopotential temperature (degress Celsius) and wind (knots) are presented. This combination shows the development of surface convergences in relation to the airmass in 2 metres.
Gusts during last hour, IR10.8: time sequence [1h]
For background information, gusts during the last hours are shown.
Surface observations, IR10.8: time sequence [1h]
Surface observations are given for completion.
Lightning detection over last 30 min, IR10.8: time sequence [30min]
This chapter shows the lightning detection during the last 30 minutes. The movement can be observed and the intensity of the thunderstorms can be estimated.
Radar
DWD PI: time sequence [1h]
This chapter offers the radar reflectances over Germany. The PI product (international radar composite) by the German Meteorological Service (DWD) is used.
Nowcasting-SAF: Lifted index
Lifted Index: time sequence [1h]
In this chapter the interpretation of the Lifted Index and its limitations are discussed. We will consider the time period 06 UTC to 15 UTC. The images from this time period show the pre-conditions, onset and development of convection.
Summary
Satellite data enable us to study both the large-scale situation and the regional thunderstorm situation by the interpretation of cloud structures, cloud top temperatures (CTT), water vapour in the upper troposphere and channel combinations in various RGB composites. Important criteria, like character and intensity of the thunderstorm development become apparent in satellite images.
The development of multi cells and super cells were described using Enhanced IR imagery. With the HRV composite overshootings could be detected which were not revealed by IR imagery due to lower spatial resolution. Radar data are important for investigations of structures below the resolution of Meteosat-images in Europe. Additionaly to satellite images, a better overview of precipitation amount, precipitation type and the inner structures of convective cells can be obtained. The combination of radar and lightning data with satellite images gives further hints to the convective structures like multi cells or super cells. Especially, the most active part of squall lines can be identified with radar and lightning data.
Dark stripes in WV images give the first hint to possible convection because this structure becomes already visible before clouds develop. East of this dark stripe we should be aware that convection occurres according to the conceptual model "Enhancement of convection by PV". West of the dark stripe we should assume convection according to the conceptual model "Convective cloud features at the leading edge of frontal cloud bands".
The airmass RGB delivers not only information about the position of PV (purple colours) and the different airmasses but also 3-dimensional structures. WV often contains information about the upper layers of the troposphere. The airmass RGB shows also clouds in lower or middle parts of the troposphere. This 3-dimensional information might give clear hints to higher probability of convection, e.g. enhancement of moderate convection by approaching PV.
Whereas the IR-channel gives only information about cloud top temperatures, the RGB "Convective storms" contains information about the ice particles' size. In combination with the shape, the location of most intense updrafts and weather events in a convective cloud complex can be detected.
Synoptic data gives the most accurate information about weather, precipitation, gusts and also some information about air masses and the risk for thunderstorms (e.g. pseudopotential temperature). Also, surface pressure tendencies and wind barbs are useful to consider some dynamical processes (e.g. wind convergences in relation to dipole structures of pressure tendencies). The main problem is the coarse observation network. Even over Central Europe, synoptic data is not sufficient to get a complete overview about the weather situation. The same holds true for radiosounding, which deliver the best evaluation for one location. However, they are only representative for homogenous air masses.
The Nowcasting-SAF-Product "Lifted Index" (LI) is only available in cloud free areas. It leads to valuable hints about regions of potential instability for nowcasting. However, the LI should be used in combination with other information about convection's triggering, e.g., dyncamical forcings. Investigations of 3 days in the diploma thesis (Linda Noel, 2007: "Praktischer Nutzen der Instabilitätsindizes und des Gesamtwassergehaltes aus Meteosat-Daten der zweiten Generation") yield a better quality of 12h-forecasts from the ECMWF compared to the corresponding satellite data. A big advantage of model results is its availability in cloudy areas. The conclusion is that LI-values from satellite data are useful for nowcasting purposes and as long the newest model results are not available. Later on ECMWF-data should be considered.