Synoptic Situation: Satellite Images, weather and basic numerical parameters
In the set of satellite image several convective events occurring on the 29th and 30th of May 2005 are observed. The origin on why these cells trigger is however of great difference. In the satellite image below a large N-S oriented frontal system over Spain and France and further North can be seen. Already embedded are some convective cells. As the case evolves several more cells will develop on the leading side of this front. Further to the South East also over Greece and Turkey numerous cells develop. This development differs because there is no frontal interaction involved as they develop under daytime convection in a lable atmosphere.
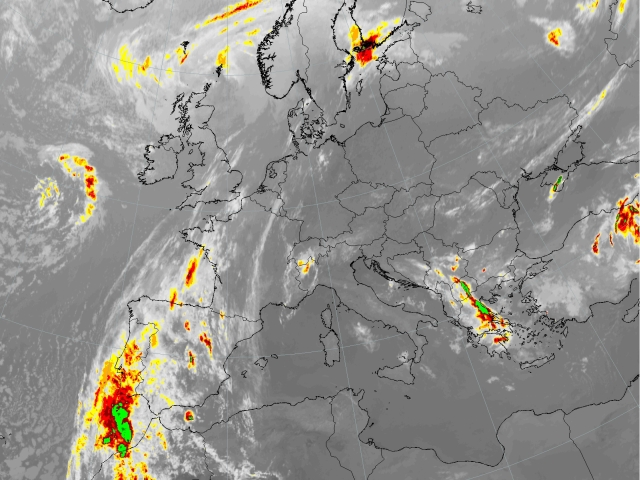
29 May 2005/00.00 UTC - Meteosat 8 Enhanced IR10.8
|
As the day advances more cells are seen to develop. Especially on the coastlines of Turkey and Greece huge cells develop. In the second stage of the case study a large system of supercells forms at the leading edge of the front over Austria, Czech Republic and Poland. Both events where characterised by hail, devastating the crops in these areas. |
Meteosat 8 IR10.8μm: time sequence
The first chapter dealing with the synoptic situation describes the convective developments seen over Central Europe and over Greece and Turkey using plain Meteosat infrared 10.8 μm. The channel is appropiate as it pictures the ice in high clouds quite clearly. In a sequence of 1 hour the relevant satellite image is presented and described.
Meteosat 8 Enhanced IR10.8μm: time sequence
In this chapter again Meteosat 8 infrared 10.8 μm is shown, but the images have been artificially colour enhanced. This will improve the discrimination of where the evolution from water into ice is taking place during the several convective stages. In a sequence of 1 hour the satellite images are presented and described.
Meteosat 8 WV6.2μm:time sequences
The chapter presents the several convective developments over Central and South-East Europe using Meteosat 8 WV6.2 channel. The channel is suitable as it gives an idea of the upper tropospheric humidity (UTH) and gives a view of the upper air dynamics. For the 29th and 30th of May hourly images are presented.
Meteosat 8 composite WV6.2μm-WV7.3μm; IR3.9μm-IR10.8μm; NIR1.6μm-VIS0.6μm: selected time sequence
In this chapter the convective developments over Central and over South-East Europe is studied using the so-called "severe convection RGB". On red the brightness temperature difference (BTD) of the two water vapour channels 6.2 and 7.3. On green the BTD of the infrared channels 3.9 and 10.8 and on blue the BTD of the two visible channels 1.6 and 0.6, respectively, are pictured.
Meteosat 8 composite WV6.2μm-WV7.3μm; IR9.7μm-IR10.8μm; WV6.2iμm: time sequence
In this chapter the convection is studied using the "Airmass RGB". Unlike the "Severe Convection RGB" discussed previously this RGB does not use any visible channels making it thus also suitable to detect nighttime convection. The receipe of this RGB is that on red the brightness temperature difference (BTD) of the two water vapour channels 6.2 and 7.3 is pictured. On blue the BTD of the infrared channels 9.7 (Ozone channel) and 10.8 and finally on green WV channel 6.2. Using this channel combination different airmass are recognised. Polar and Tropical Airmass are pictured in blue and green, resp. The WV dark stripes discussed previously are pictured in red.
Meteosat 8 IR10.8 and Geopotential Height 1000 hPa.: time sequence
In the following chapter the cloud configurations seen in satellite images are related to the basic field of surface pressure represented by geopotential height in 1000 hPa. 6-hourly sequences are shown.
Meteosat 8 IR10.8 and Geopotential Height 300 hPa.: time sequence
In the following chapter the cloud configurations seen in satellite images are related to the basic field of the upper level height in 300 hPa. 6-hourly sequences are shown.
Meteosat 8 IR10.8 and Surface observations: time sequence
In the following set of images observations of rain, hail and thunderstorms are related to the cloud configurations seen in satellite images in 3-hourly sequences.
Detection of Precipitation: time sequence
Large hail is regularly observed in association with intense thunderstorms (as in this case study) and is often the cause of severe damage on e.g. crops, roofs and cars. Hail is a local phenomenon, in both time and space, so that it can not be easily detected using satellite imagery or with surface observations (since the density is to coarse). Due to its widespatial coverage and relatively fine spatial and temporal resolution, weather radar appears as a valuable tool for the real-time detection of hail (Holleman, 2002). For both convective regions the radar is presented and described for the 29th and 30th May 2005.
Summary of the investigations in this chapter
The set of satellite images showed some severe convective development over large parts of Europe. In central Europe the convection was each time located at the leading edge of a front. the set of Airmass images and WV6.2 images showed areas of deepening at these locations creating a lable atmosphere in which convection could quickly and easily arise.
Further to the southeast in Greece and Turkey also deepening of stratospheric was observed. All convective cells developed on the boundary of these dark stripes. Because of an induced seabreeze most convection was found in coastal regions of these two countries.
The Severe convection RGB showed the contents of the cells as the different colours easily tell whether the cell is consistant of large ice particle or small ice particles. This way made it easier to discriminate if the cells would further enhance or not.
In the next chapter the development will be studied using derived parameters. It will also be followed using products from the Nowcasting SAF, Radar and with the Global Instability Index (GII).