Meteorological Physical Background
These theories can be applied to explain Extra Tropical Transition.
As already mentioned the phenomena of Extra Tropical Transition is not fully understood. This module has exclusively used the Hart and Evans theory to explain Extra Tropical Transition as this is currently the preferred theory.
- Hart and Evans
ABSTRACT:- Forty-six percent of Atlantic tropical storms undergo a process of extratropical transition (ET) in which the
storm evolves from a tropical cyclone to a baroclinic system. In this paper, the structural evolution of a base
set of 61 Atlantic tropical cyclones that underwent extratropical transition between 1979 and 1993 is examined.
Objective indicators for the onset and completion of transition are empirically determined using National Hurricane
Centre (NHC) best-track data, ECMWF 1.1258 3 1.1258 re-analyses, and operational NCEP Aviation
Model (AVN) and U.S. Navy Operational Global Atmospheric Prediction System (NOGAPS) numerical analyses.
An independent set of storms from 1998 to 2001 are used to provide a preliminary evaluation of the proposed
onset and completion diagnostics.
Extratropical transition onset is declared when the storm becomes consistently asymmetric, as measured by
the 900–600-hPa thickness asymmetry centred on the storm track. Completion of the ET process is identified
using a measure of the thermal wind over the same layer. These diagnostics are consistent with the definitions
of tropical and baroclinic cyclones and are readily calculable using operational analyses. Comparisons of these
objective measures of ET timing with more detailed three-dimensional analyses and NHC classifications show
good agreement.
Abstract:- ET storms, as well as non-transitioning (NT) storms, that make landfall or near landfall are frequently associated with significant mesoscale precipitation events that can lead to major inland flooding (e.g., Floyd 1999) or severe weather outbreaks (e.g., Frances 2004 or Ivan 2004). Distinguishing between ET and NT storms is important because of the capacity of the former category of storms to wreak havoc in populated areas.
SUHONG MA,* HAROLD RITCHIE,1 JOHN GYAKUM,# JIM ABRAHAM,1 CHRIS FOGARTY,@ AND RON MCTAGGART-COWAN#
*National Meteorological Centre, Beijing, China
1Meteorological Service of Canada, Environment Canada, Dorval, Quebec, Canada
#Department of Atmospheric and Oceanic Sciences, McGill University, Montreal, Quebec, Canada
@Meteorological Service of Canada, Newfoundland Weather Centre, Gander, Newfoundland, Canada.ABSTRACT
Former Hurricane Earl re-intensified rapidly while traveling through Canadian waters in September 1998. Its central pressure decreased 40 hPa over a 36-h period, and it produced heavy rain on Cape Breton Island, Nova Scotia, and over Newfoundland. A diagnostic study is conducted from a potential vorticity (PV) perspective using Canadian Meteorological Centre (CMC) regional analysis data. Former Hurricane Earl’s rapid redevelopment was related to the interaction between two preexisting positive PV anomalies: a diabatically generated low-level anomaly and an upper-level anomaly. This process was accompanied by a cold air intrusion and warm air ‘‘wrapping up’’ process. As well, the behaviour of the operational CMC numerical weather prediction models is examined using output from the ensemble forecast system (giving 10-day forecasts, with eight members and one control run) integrated from three different initial times (0000 UTC on each of 3, 4, and 5 September 1998). Some members failed to maintain former Hurricane Earl’s observed closed cyclonic circulation during the weakening period, and subsequently developed only a weak low pressure system. Others maintained the identity of former Hurricane Earl throughout both the weakening and re-intensifying periods. Static PV inversions suggest that the more successful forecasts of Earl’s Re-intensification were associated with preferentially strong lower tropospheric cyclonic circulations induced by the upstream upper-tropospheric PV maximum. This induced lower level flow also produced the very large-amplitude low-level thermal perturbations characteristic of a deepening baroclinic low.
- Hoskins theory based on PV and PV anomalies
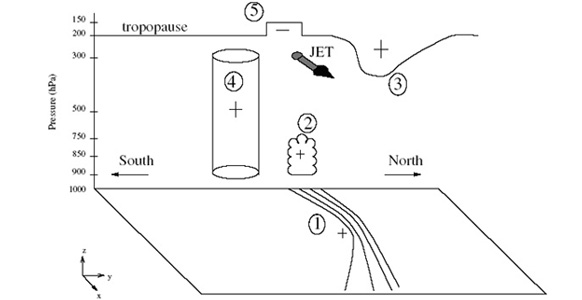
As PV anomalies and baroclinic zones are involved in the development of both Waves it can provide a good example to the Hoskins theory. This theory states that an upper level PV anomaly, with its associated lowered tropopause, overrunning a low level baroclinic zone induces a cyclonic circulation within the upper levels of the troposphere. In the Figure 1. below this phenomena is graphically represented. As a result of the deepening of the troposphere because of the existence of a postive PV anomaly air is drawn into the column. Alternatively, the sea pressure sinks and due to the coriolis force a cyclonic rotation exists.
Fig 1. Graphical representation of a positive PV anomaly overrunning a baroclinic zoneThe idea behind this theory goes according to the recognition of PV-anomalies. These upper-level anomalies that cause the tropopause to sink are characterised in the WV imagery as dark shaded areas. These characteristics of an upper-level PV anomaly can be examined in more detail and a discrimination in positive and negative upper-level PV anomalies can be made.
In practise the lowering of the tropopause is almost always picked up by the WV-imagery (dark stripes and darker areas), but also by the modelfields. The height of PV=1 is found at some stages at 500 hPa, where it normally would resides at 0 to 100 hPa. Positive values for the PV-anomaly and therefor a a clear indicator the above described Hoskins theory.
- In the case of a positive PV anomaly, the isentropes are characterised by higher values than in the surrounding areas (indicating colder air). The height of the tropopause has a local minimum. The corresponding pressure and wind field shows an area with low pressure and a cyclonic circulation. The cyclonic circulation is a result of the coriolis force. As the pressure at the surface drops, so will the upward motion increase, which draws air in hat begins to rotate due to the coriolis force. At the northern hemisphere this force is directed cyclonically.
- In the case of a negative PV anomaly, the isentropes are characterised by lower values than in the surrounding areas (indicating warmer air). The height of the tropopause has a local maximum. The corresponding pressure and wind field shows an area with high pressure and an anticyclonic circulation.