31st July 2004: 12UTC
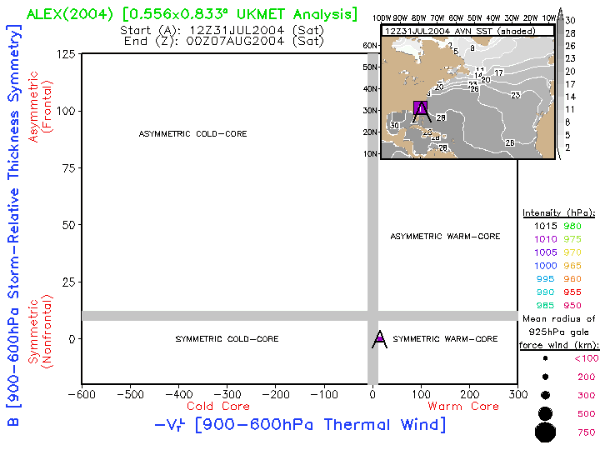
In the right of the upper screen we will follow the path of alex as it tracks from position A to position Z at the end of the sequence. In the main screen the change from symmetric to assymetric, from warm to cold core can be followed. The size of the cyclone (mean radius of the 925-hPa gale force wind region) corresponds to the size of the solid circles along the phase trajectory (largest shown is approximately 500 km). Circle shading corresponds to the intensity of the cyclone. The
track of the cyclone is plotted in the inset, with the date marked at the 0000 UTC positions.
1st August 2004: 00UTC
The degree of symmetry is calculated as the thickness variation measured across the storm perpendicular to track, with the storm width fixed at a value of 500 km, a typical maximum value.
A thickness value of 0 m would theoretically denote the change from symmetric to asymmetric, a value of 10m has been found to best represent practically the critical start of transformation because it allows for analysis, model and tracking errors.
2nd August 2004: 00UTC
A thickness value of 0 m would theoretically denote the change from symmetric to asymmetric, a value of 10m has been found to best represent practically the critical start of transformation because it allows for analysis, model and tracking errors.
3rd August 2004: 00UTC
To balance the hydrostatic equation, warm core systems have winds that decrease with height, whereas in cold core systems winds increase with height. The relative core temperature is measured using the variation in thermal winds in the lower troposphere between 900-600 hPa. To gauge the depth of the core structure the process can be repeated between 600-300 hPa and a comparison made between the two values. The central pressure of Alex has fallen 10 hPa.
4th August 2004: 00UTC
The Tropical Phase finishes and the Transformation Phase commences when the hurricane becomes asymmetric and the central pressure continues to fall a futher 5 hPa.
5th August 2004: 00UTC
If winds decrease with height in the lower trop but not in the higher trop the hurricane is shallow warm core, which is typical of hurricanes that develop in the high tropics where they form over lower sea temperatures and over a reduced timescale. If winds decrease with height throughout the trop the system is deep warm core and the hurricane is likely to have originated in the deep tropics so it will have had longer develop and over higher sea temperatures.
With an unchanged core pressure of 995 hPa the cyclone now transforms from warm core into cold core assymetric cyclone.
5th August 2004: 12UTC
The Transformation Phase finishes when the ex-hurricane becomes cold core; during the Transformation phase the system is deemed to be hybrid, possessing as it does both tropical and extra-tropical characteristics.
6th August 2004: 00UTC
As hurricane alex continues to move north east over cooler waters and begins to engage the westerlies the central pressure remains the same with no further deepening occuring.
6th August 2004: 12UTC
Alex continues to move east with greater velocity the speed of alex as it moves across the atlantic approaches 40 KT as is moves along in the westerly flow. At this stage alex is not associated with any development areas so central pressure remains the same.
7th August 2004: 00UTC
Alex continues to move east and is with greater speed , however it's position in relation to any development areas, has nmeant that the surface preesure has remained the same.